

Trading Tools

Essential Trading Tools: Charts, Calculators, ATR, Calendars and Journals

A short, practical list of the tools traders actually use, what each is for, and how ATR and a spreadsheet journal fit in.

Essential Trading Tools: Charts, Calculators, ATR, Calendars and Journals (featured illustration)

Quick answer

Core trading tools are a charting platform, a broker or exchange platform, a position-size calculator, a volatility measure such as ATR, an economic calendar and a trading journal. Learn a few well and keep your chart clean. Tools make a process easier to repeat; they do not replace a plan or risk control.

Key takeaways

  • Start with a charting platform, a broker platform, a calculator and a journal.
  • ATR measures typical movement per candle and helps size a stop; it does not show direction.
  • An economic calendar helps you avoid being surprised by scheduled events.
  • A spreadsheet is enough to start a journal.

Which trading tools do you really need?

New traders often collect tools before they have a process. A small, well-understood set beats a large one you only half use.
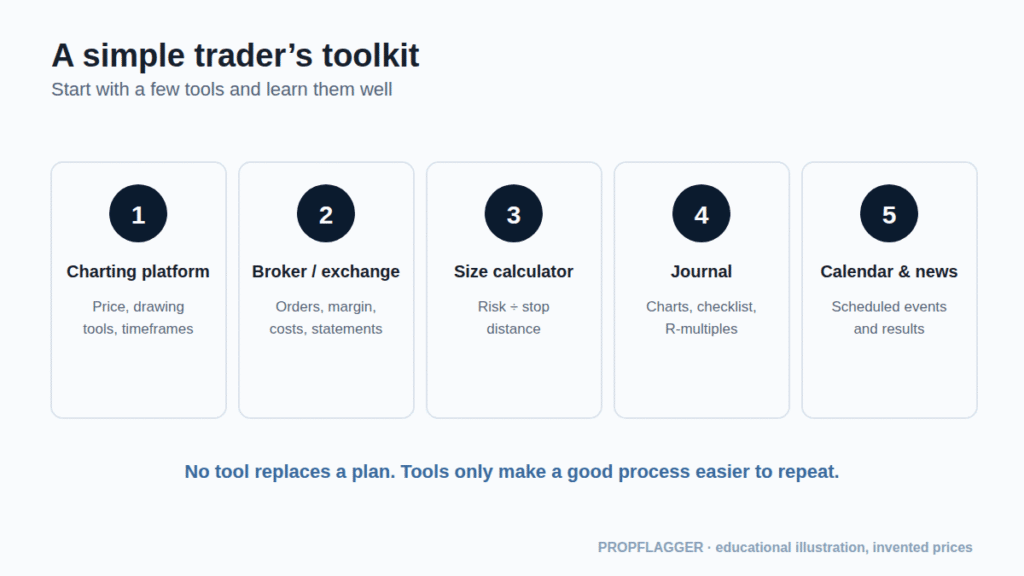
Five tool categories: charting platform, broker, size calculator, journal, calendar and news
A simple toolkit.
  1. Charting platform: price, drawing tools and timeframes.
  2. Broker or exchange platform: orders, margin, costs and statements.
  3. Position-size calculator: converts risk and stop distance into quantity.
  4. Journal: charts, checklist and R-multiples.
  5. Calendar and news: scheduled events and results.

What should you look for in a charting platform?

  • Candlestick charts for the instruments you trade, with all timeframes you need.
  • Drawing tools for levels, zones and trendlines, and the ability to save templates.
  • Alerts, so you do not have to stare at the screen.
  • Easy screenshots to attach to journal entries.

Web-based platforms such as TradingView are popular and have free tiers; your broker’s own platform is also fine. Learn how to read the chart first (see chart analysis), because the tool does not do that for you.

What is a broker platform for?

This is where you place and manage real orders. Before funding it, understand order types (market, limit, stop), margin requirements, brokerage and other charges, and how to square off a position quickly. Use two-factor authentication, install apps only from official stores and never share login codes.

How does a position-size calculator work?

It applies one formula: (account × risk %) ÷ (entry − stop). You can do this in a spreadsheet cell. See the worked example in the risk management guide.

What is ATR and how is it used?

The Average True Range (ATR), developed by J. Welles Wilder Jr., measures volatility: how far price typically moves per candle. First the true range is the largest of the candle’s high minus low, the high minus the previous close, and the previous close minus the low (absolute values). ATR is a smoothed average of that, usually over 14 periods. It says nothing about direction.
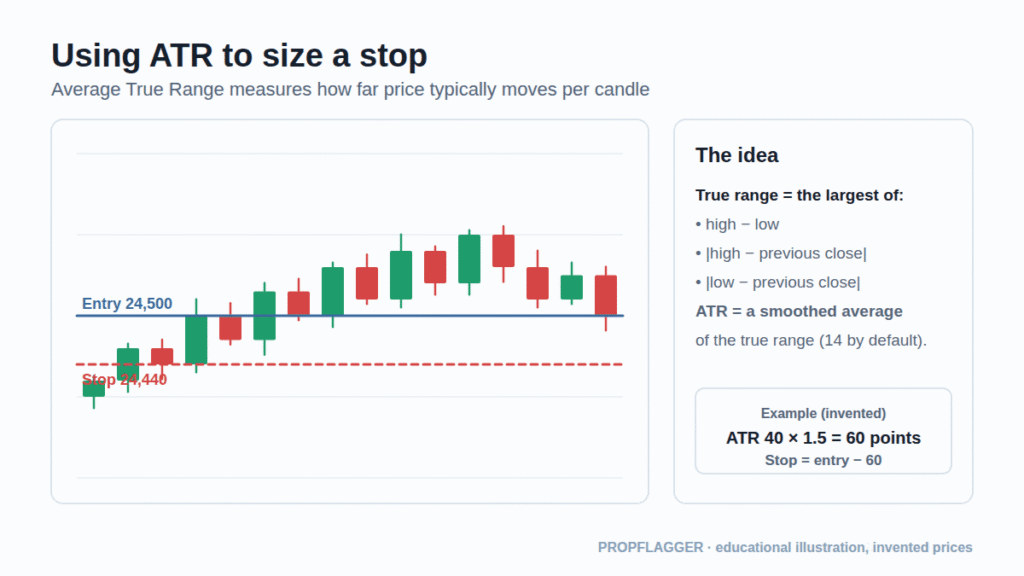
Candlestick chart with an entry and a stop placed one and a half ATR away, plus the true range definition
Using ATR to place a stop. Numbers are invented.

Traders use it to keep stops proportional to current volatility. For example, if ATR is 40 points and the stop is placed 1.5 × ATR from entry, the stop is 60 points away; a quieter market gives a tighter stop and therefore a larger position for the same risk. Multipliers are a choice, not a rule, so test them.

Why use an economic calendar?

An economic calendar lists scheduled events such as inflation releases, central-bank decisions and employment data. Prices can move sharply around them and spreads can widen. Many traders avoid opening trades just before major events or reduce size. Compare the forecast with the actual figure, but remember that the market’s reaction is not always what the number suggests.

What is a good journal tool?

You can start with a spreadsheet and a screenshot folder. A dedicated journal stores charts, checklists and statistics together. The key is that you record every trade and review the results weekly (see how to keep a trading journal).
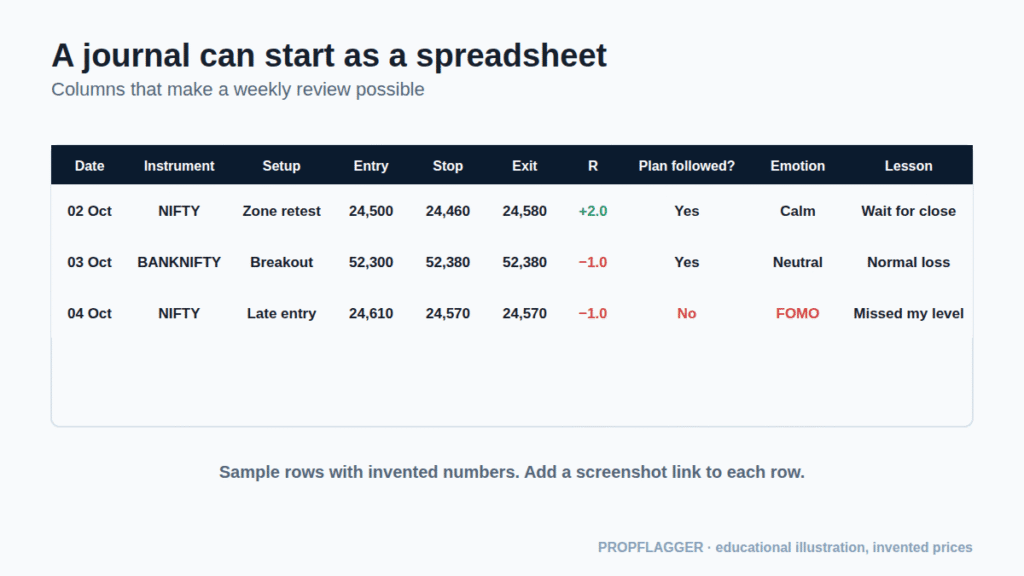
Spreadsheet with columns for date, instrument, setup, entry, stop, exit, R, plan followed, emotion and lesson
Columns for a spreadsheet trading journal.

How do you avoid tool overload?

  • Write down what question each tool answers.
  • Remove any indicator you cannot explain.
  • Keep the same chart template for every trade so your journal is comparable.
  • Spend time on process, not on finding a “perfect” indicator.

Educational content only. Tools mentioned are examples, not endorsements or recommendations.

Key terms

ATR
Average True Range, a volatility indicator introduced by J. Welles Wilder Jr., usually a 14-period average.
True range
The largest of: high − low, |high − previous close|, |low − previous close|.
Economic calendar
A schedule of data releases and central-bank events that can move markets.
Screener
A tool that filters instruments by criteria such as volume or price.

Frequently asked questions

What tools do I need to start trading?

At minimum: a regulated broker account and its trading platform, a charting tool, a way to calculate position size, and a journal to record trades. Everything else is optional until you know you need it.

What is ATR and how do traders use it?

ATR, the Average True Range, measures how far price typically moves in a candle. It is derived from the true range and smoothed over a period, commonly 14. Traders use it to judge volatility and to set stop distances, for example 1.5 times ATR from entry.

Why use an economic calendar?

An economic calendar lists scheduled releases such as inflation data and central-bank decisions. Knowing when they occur helps you avoid holding a position through an event by accident, or prepare for higher volatility.

Do I need to pay for trading tools?

Not to begin. Many charting platforms have free tiers, and a spreadsheet can serve as a journal and calculator. Pay only for a feature you have used enough to know you need.

How many indicators should I use?

Fewer is usually clearer. Many traders use price, levels and one or two indicators, such as a moving average and ATR. Each indicator should answer a specific question you can state in one sentence.

Sources and further reading

  1. Wikipedia: Average true range
  2. StockCharts ChartSchool: Average True Range (ATR)
  3. BabyPips: economic calendar
  4. IG: why traders care about economic calendars

External links open in a new tab. They are provided for reference and are not endorsements.

Last reviewed: . Written by the PropFlagger editor for education. Diagrams use invented prices. Nothing here is financial advice or a recommendation to trade.

Tags:

2 comments

Join the discussion

Your email address will not be published. Required fields are marked *

Comments are moderated. Please do not post trade signals, tips, links to paid groups, or claims of guaranteed returns.