

Why keep a trading journal?
Memory is selective. We remember the big win and the painful loss and forget the ordinary trades in between. A trading journal replaces memory with evidence, so you can see what you actually do, not what you think you do.
It also creates accountability. When you know you must write down the reason for a trade before you place it, impulsive trades become harder to justify.
What should you record for every trade?
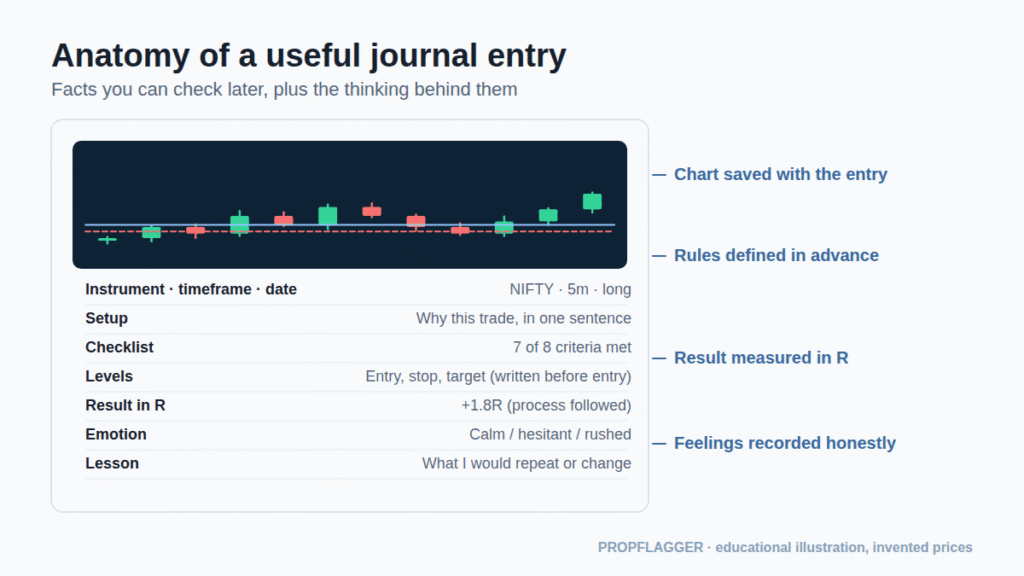
- Facts: date, instrument, timeframe, direction.
- Charts: an original screenshot and an annotated one, saved at the time.
- Plan: setup name, entry, stop, target and planned risk, written before entering.
- Checklist: which of your criteria were present.
- Result: exit price and the result in R.
- Behaviour: did you follow the plan? Any early exit, moved stop or extra size?
- Emotion: calm, hesitant, rushed, angry.
- Lesson: one sentence on what to repeat or change.
Process or outcome: which should you judge?
Judge the process first. A good outcome from a poor process is luck you cannot rely on; a bad outcome from a good process is a normal cost of trading.
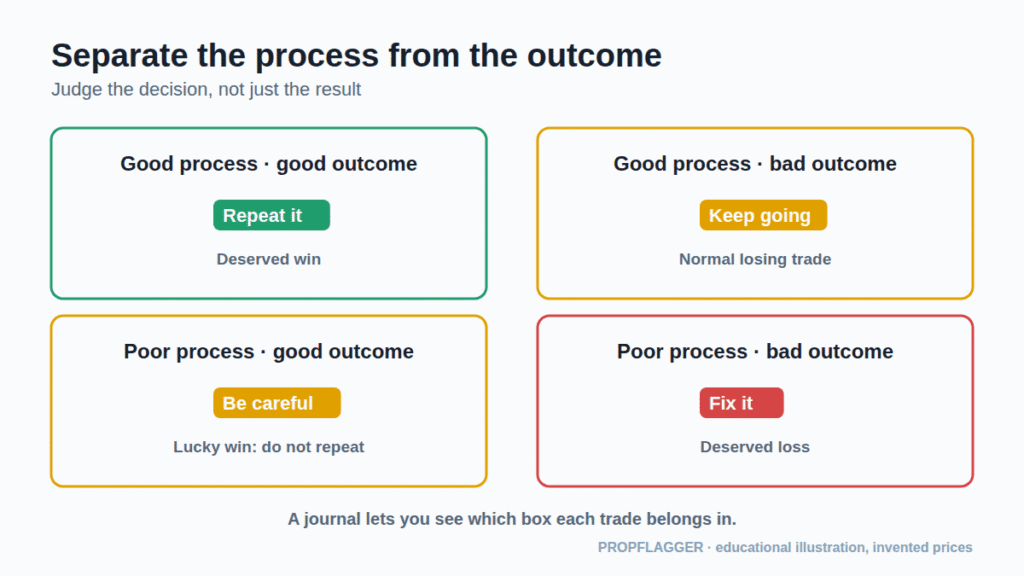
- Good process, good outcome: repeat it.
- Good process, bad outcome: keep going; losses are part of any probabilistic approach.
- Poor process, good outcome: be careful; do not reinforce the habit.
- Poor process, bad outcome: fix the rule that was broken.
On PropFlagger this separation is built in: every entry has a Strategy Match percentage that records how many criteria were present, shown beside the result. The two numbers are independent on purpose.
How do you run a weekly review?
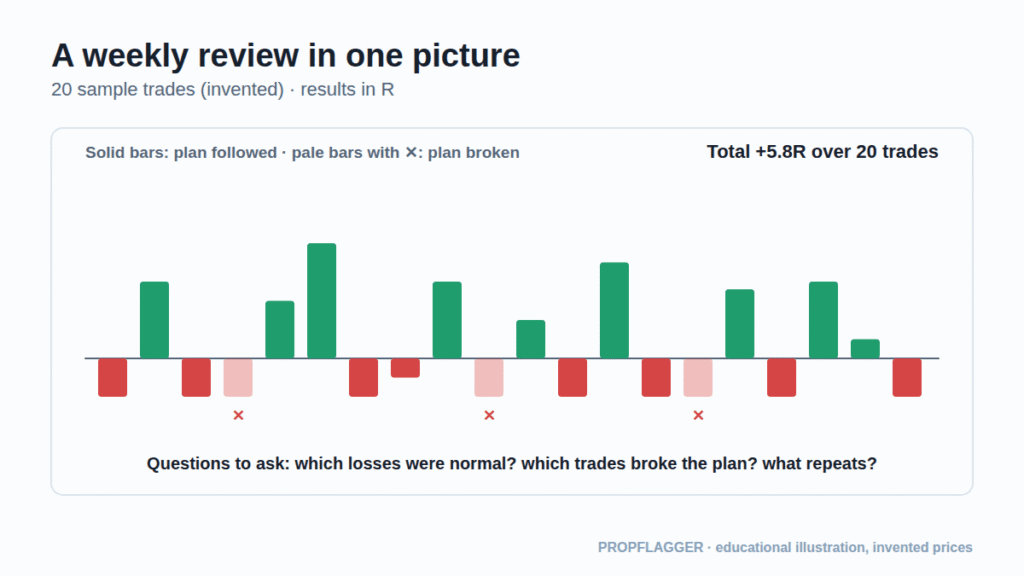
- List the week’s trades in R and total them.
- Mark every trade where the plan was broken.
- Read your lessons for repeated words (“rushed”, “moved stop”, “late”).
- Compare setups: which had a positive average R, and how many trades back it up?
- Choose one change for next week, such as “no entries in the first five minutes”.
Which numbers are worth tracking?
| Metric | What it tells you |
|---|---|
| Win rate | How often trades finish positive. Meaningless without average win and loss. |
| Average R (expectancy) | Average result per trade in units of risk (see risk management). |
| Profit factor | Total gains divided by total losses. |
| Adherence | Percentage of trades that followed the plan. |
| Largest drawdown | Worst fall from a peak, in R or percent. |
Small samples are noisy. Treat figures from under 30 trades as anecdotes.
Common journaling mistakes
- Only logging winners (or only losers). Log everything.
- Writing the reason after the result. Hindsight rewrites the story.
- Too many fields. If it takes 15 minutes, you will stop. Start with five fields.
- Never reading it. A journal you do not review is just storage.
What tool should you use?
A spreadsheet and a screenshot folder are enough to start (see trading tools). A dedicated journal keeps charts, checklists and statistics together. You can see how this site does it in the public journal.
Educational content only. Sample data is invented and is not a performance claim.
3 comments