

What is risk management in trading?
Risk management is the set of rules that limit how much you can lose, on a single trade, in a day and in total. Entries get the attention, but the size of your losses is the part you control most.
It matters because markets are uncertain. Even a good setup loses often, so survival depends on keeping each loss small enough to take the next trade calmly.
How do you calculate position size?
Start with how much you are willing to lose if the trade fails, then work back to the quantity:
Position size = (account size × risk %) ÷ (entry price − stop price)
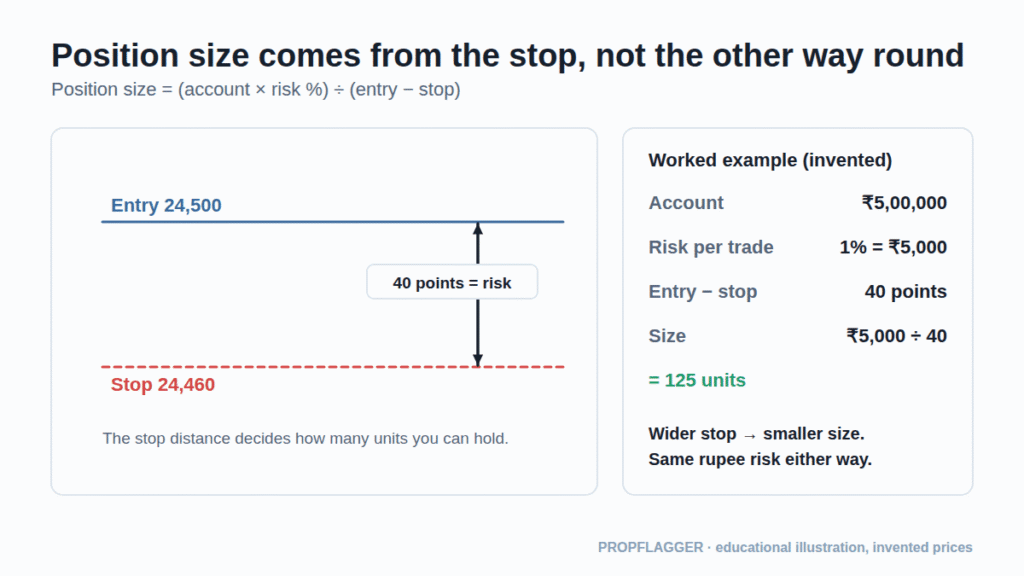
Worked example (invented numbers): an account of ₹5,00,000 and a risk of 1% means ₹5,000 at risk. If the entry is 24,500 and the stop 24,460, the stop distance is 40 points, so 5,000 ÷ 40 = 125 units. A wider stop means a smaller position, so the rupee risk stays the same.
Check the contract size or lot size of what you trade; if the minimum size already risks more than your limit, the trade does not fit your plan.
How much should you risk per trade?
Many educators suggest 1–2% of the account or less per trade. This is a convention, not a guarantee of safety. A smaller percentage lets you survive longer losing streaks; a larger one makes drawdowns arrive faster. Choose a number you can follow after three losses in a row, and write it in your plan.
Where do you put a stop-loss?
A stop belongs where your idea is clearly wrong, not where it fits a size you want. Typical reference points are beyond a swing high or low, beyond a zone, or a multiple of the Average True Range (ATR) away from entry. ATR adapts the distance to current volatility. Avoid placing it exactly at an obvious level where orders cluster (see liquidity).
What is an R-multiple?
One R is the amount you risk on a trade. If your stop is hit, you lose 1R. A trade that makes twice the risk is +2R.
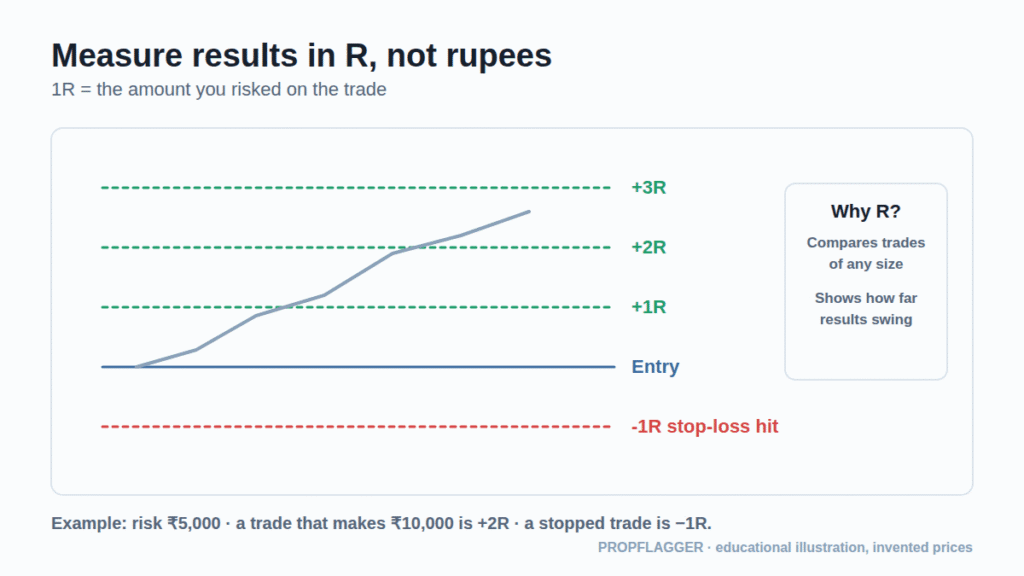
R lets you compare trades of different sizes and instruments, and shows the shape of your results. A series like −1R, −1R, +3R, −1R, +2R is easy to read; the same trades in rupees are not.
What is expectancy?
Expectancy combines how often you win with how much you win and lose:
Expectancy = (win rate × average win) − (loss rate × average loss)
Example in R: you win 40% of trades with an average win of +2R and lose 60% with an average loss of −1R. Expectancy = 0.4 × 2 − 0.6 × 1 = +0.2R per trade. A high win rate does not guarantee a positive expectancy, and a low win rate can still work if winners are larger than losers. The estimate is only meaningful over a large sample of trades, and costs such as brokerage and slippage reduce it.
Why are big losses so hard to recover?
The gain needed to get back to even is loss ÷ (1 − loss). A 10% loss needs about an 11% gain; a 50% loss needs a 100% gain.
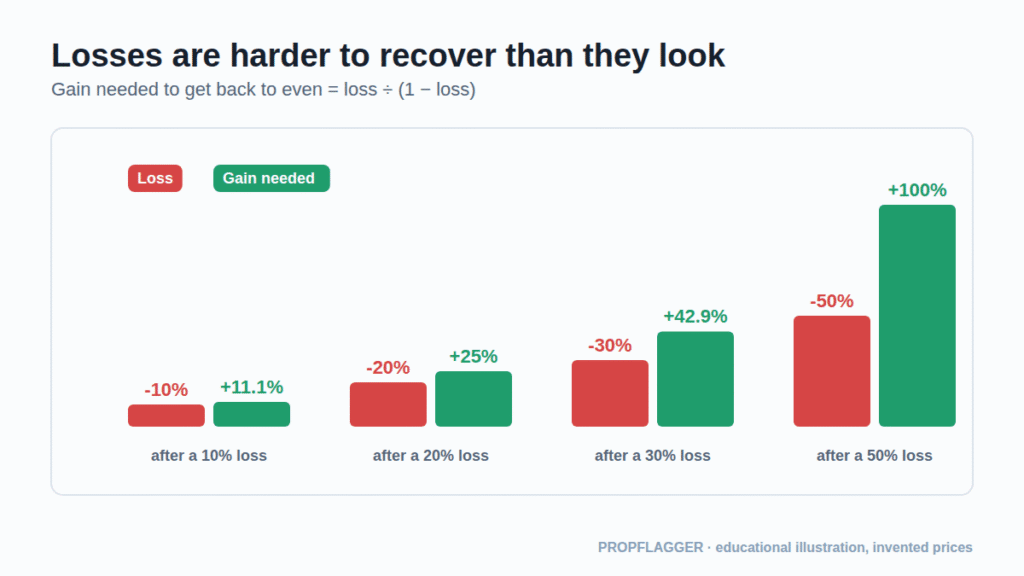
| Loss | Gain needed to break even |
|---|---|
| 10% | 11.1% |
| 20% | 25.0% |
| 30% | 42.9% |
| 50% | 100% |
What other rules protect an account?
- Daily loss limit: stop trading for the day after a set loss, such as 2–3R.
- Maximum open risk: cap the combined risk of all open trades.
- Leverage awareness: margin and options multiply gains and losses. In SEBI’s study of individual F&O traders, about 93% recorded net losses over FY22–FY24 (and about 91% in FY25), which is why risk limits come before strategy.
- No adding to losers unless that is part of a tested plan.
- Review: record planned risk and actual risk for every trade.
Common risk-management mistakes
- Moving the stop further away after entry.
- Sizing from the money you want to make instead of the stop distance.
- Increasing size after a loss to “win it back” (see trading psychology).
- Risking the same rupee amount without regard to your current account size.
How do you track risk in a journal?
For each trade note the planned risk, the stop, the actual exit and the result in R. At the end of the week, check whether any trade risked more than the plan allowed. That single check often reveals more than the win rate. See the journal guide.
Educational content only. Examples use invented numbers and are not advice. Trading involves substantial risk of loss.
6 comments