Trading Strategies

Types of Trading Strategies: Trend, Breakout, Mean Reversion and More

What a trading strategy is, the main styles compared, and the backtesting traps (overfitting, look-ahead and survivorship bias) to avoid.

Types of Trading Strategies: Trend, Breakout, Mean Reversion and More (featured illustration)

Quick answer

A trading strategy is a written set of rules for what to trade, when to enter, where to exit and how much to risk. Main styles are trend following, breakout, mean reversion, momentum, swing trading and scalping. None is best; each fits a different temperament and time commitment. Test a strategy on data it was not tuned on, include costs, and record live results.

Key takeaways

  • A strategy must define entry, exit, risk and filters in advance.
  • Trend following, breakout and momentum trade with the move; mean reversion trades against a stretch.
  • Choose a style that fits your time, temperament and costs.
  • Backtests lie easily: beware overfitting, look-ahead bias and survivorship bias.

What is a trading strategy?

A trading strategy is a written plan with four parts: what you trade, when you enter (the setup), where you exit (stop and target) and how much you risk. If any part is left to mood on the day, it is a hunch rather than a strategy.

This site documents one example, TLR-001, on the strategy modules page, with a checklist that every journal entry is scored against.

What are the main types of trading strategies?
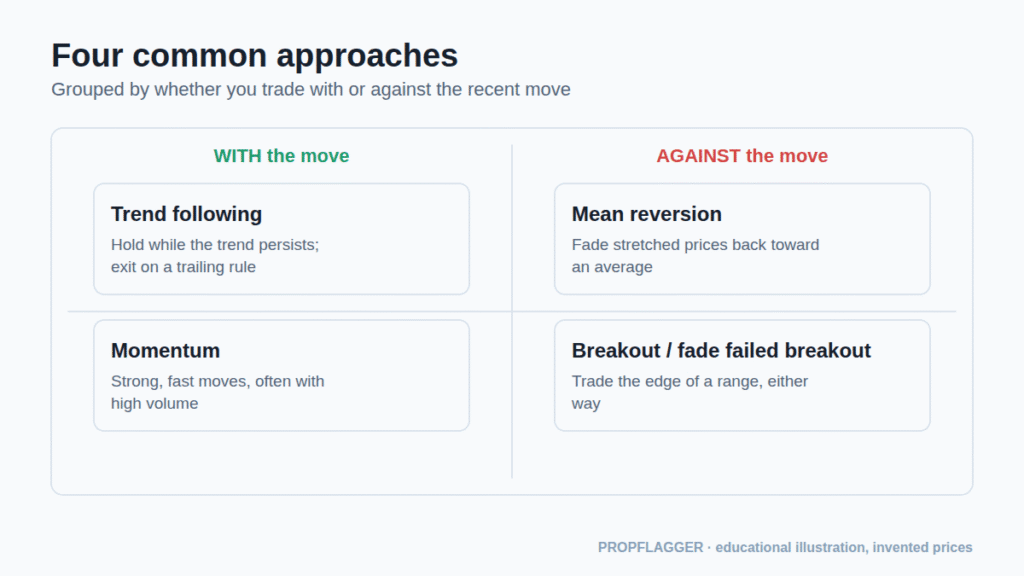
Grid showing trend following and momentum on one side, mean reversion and breakout fades on the other
Trading with or against the recent move.
Common trading styles compared
Style Idea Typical holding time Weak spot
Trend following Join an existing trend and hold until it shows signs of ending Days to months Many small losses in sideways markets
Breakout Enter when price closes beyond a range or level Minutes to days False breakouts and sweeps
Mean reversion Fade a stretched move back toward an average Minutes to days A trend can keep going and hurt large
Momentum Trade strong, fast moves, often with high volume Minutes to weeks Sharp reversals
Swing trading Capture a swing within a larger trend Days to weeks Overnight gaps
Scalping Many very short trades for small moves Seconds to minutes Costs and slippage dominate

How do breakout and mean-reversion ideas differ?

Take a market moving in a range. A breakout trader waits for price to close beyond the edge and treats that as the start of a move. A mean-reversion trader looks for rejection at the edge and expects price to return to the middle. Both can be valid, and both fail when the market does the other thing.
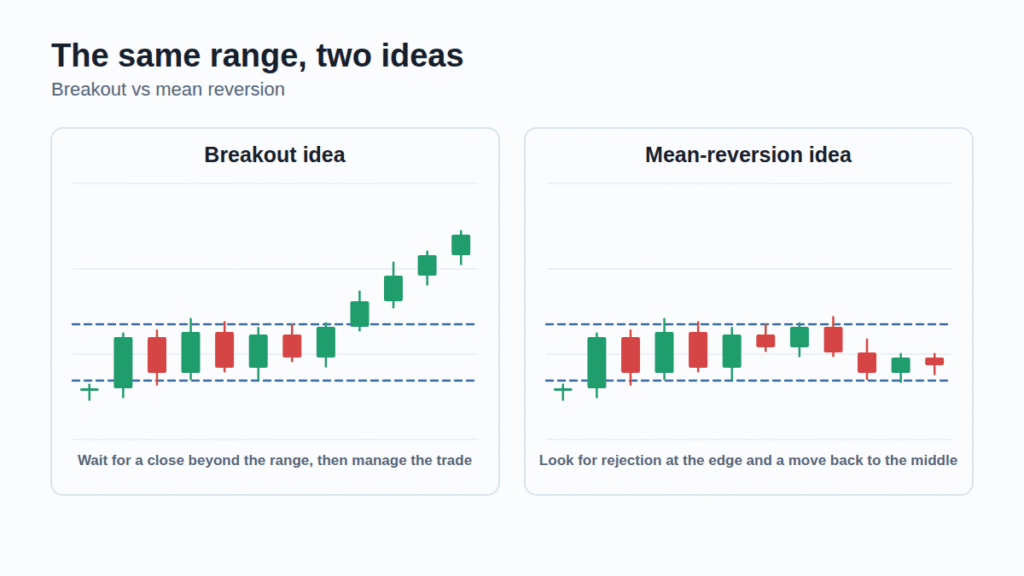
The same price range with a breakout idea and a mean-reversion idea
One range, two different ideas.

The liquidity guide describes why some apparent breakouts reverse (sweeps), and price action covers the candles traders use at the edges.

How do you choose a style?

  • Time: can you watch the screen all day, or only check once a day?
  • Temperament: can you sit through a drawdown while a trend develops, or do you prefer quick feedback?
  • Costs: short-term styles pay brokerage, taxes and spread more often.
  • Capital and risk: choose a risk per trade you can stick to (see risk management).

How do you test a strategy without fooling yourself?

Backtesting applies the rules to historical data. It is useful, and easy to get wrong:
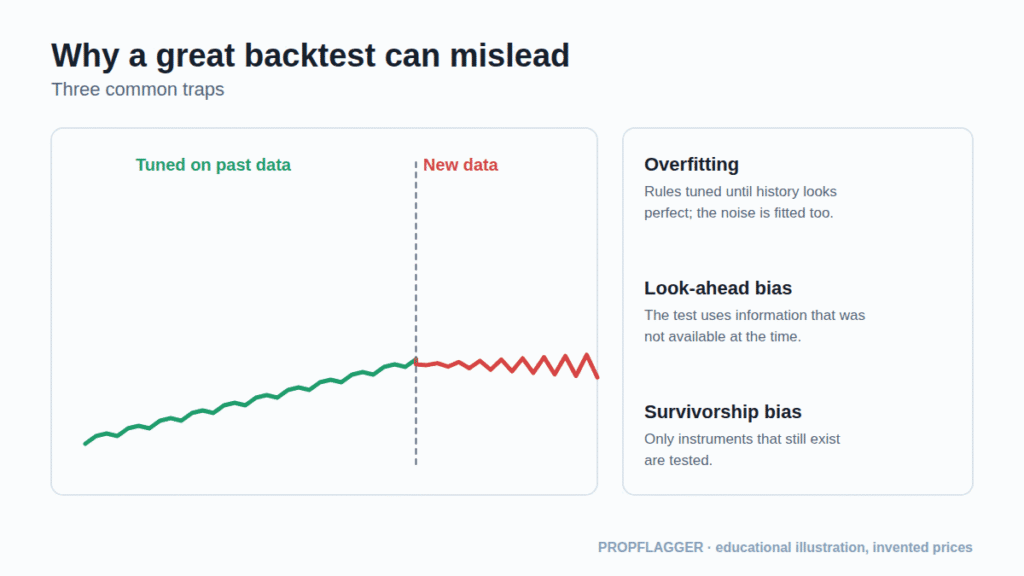
A smooth in-sample equity curve that turns noisy on new data, with three backtest pitfalls listed
A strategy tuned to the past can look perfect and fail on new data.
  • Overfitting: too many tweaks fit noise. Keep rules few and test on data you did not tune on.
  • Look-ahead bias: the test uses information (like a candle’s final close) that was not available when the decision would have been made.
  • Survivorship bias: testing only instruments that still exist ignores those that failed.
  • Ignoring costs: brokerage, taxes and slippage can erase a small edge.

After a backtest, run a forward test on paper or with very small size and keep a record of every trade.

How do you know a strategy is working?

Look at the average result per trade in R (expectancy), the maximum drawdown and how often you followed your own rules. Compare live results with the test; large gaps are a warning. A trading journal with a checklist makes this comparison possible.

Common strategy mistakes

  • Switching strategy after a few losses, before you have enough trades to judge.
  • Combining many unrelated indicators until they “agree”.
  • Ignoring the market condition: trend strategies in ranges, range strategies in trends.
  • Copying someone else’s setup without understanding its risk.

Educational content only. Strategies described here are general concepts, not recommendations. Past performance, including backtests, does not guarantee future results.
Key terms

Backtest
Applying a set of rules to historical data to see how they would have performed.
Overfitting
Tuning rules so closely to past data that they capture noise instead of a repeatable pattern.
Out-of-sample
Data that was not used to design or tune the rules.
Edge
A repeatable advantage that produces a positive expectancy after costs.

Frequently asked questions

What is a trading strategy?

A trading strategy is a written set of rules that defines what you trade, what must be true before you enter, where you exit with a profit or a loss, and how much you risk. Having rules in advance lets you test, review and improve the approach.

What is the best trading strategy for beginners?

There is no single best one. Beginners often start with simple, rules-based approaches on higher timeframes, such as trend pullbacks or breakouts of clear ranges, because they trade less often and are easier to review. Practise on paper and with small risk first.

What is the difference between trend following and mean reversion?

Trend following tries to join a move that is already under way and hold while it continues. Mean reversion expects a stretched price to return toward an average and trades against the recent move. They tend to work in different market conditions.

What is overfitting in backtesting?

Overfitting means adjusting a strategy until it fits past data almost perfectly, which captures random noise instead of a repeatable pattern. Such a strategy often performs much worse on new data. Keep rules simple and test on data you did not tune on.

How long should I test a strategy?

Long enough to include different market conditions and enough trades for the statistics to mean something, typically at least 100 trades. After a backtest, run a forward test on paper or with very small size before committing real capital.

Sources and further reading

  1. Capital.com: backtesting a trading strategy and its pitfalls
  2. TradingView ideas: types of trading strategies
  3. Groww: types of traders

External links open in a new tab. They are provided for reference and are not endorsements.

Last reviewed: . Written by the PropFlagger editor for education. Diagrams use invented prices. Nothing here is financial advice or a recommendation to trade.

Tags:

2 comments

Join the discussion

Your email address will not be published. Required fields are marked *

Comments are moderated. Please do not post trade signals, tips, links to paid groups, or claims of guaranteed returns.