

Market Structure

Market Structure Explained: Highs, Lows, BOS and CHoCH

How traders read trends from swing highs and lows, and what break of structure and change of character mean, with simple diagrams.

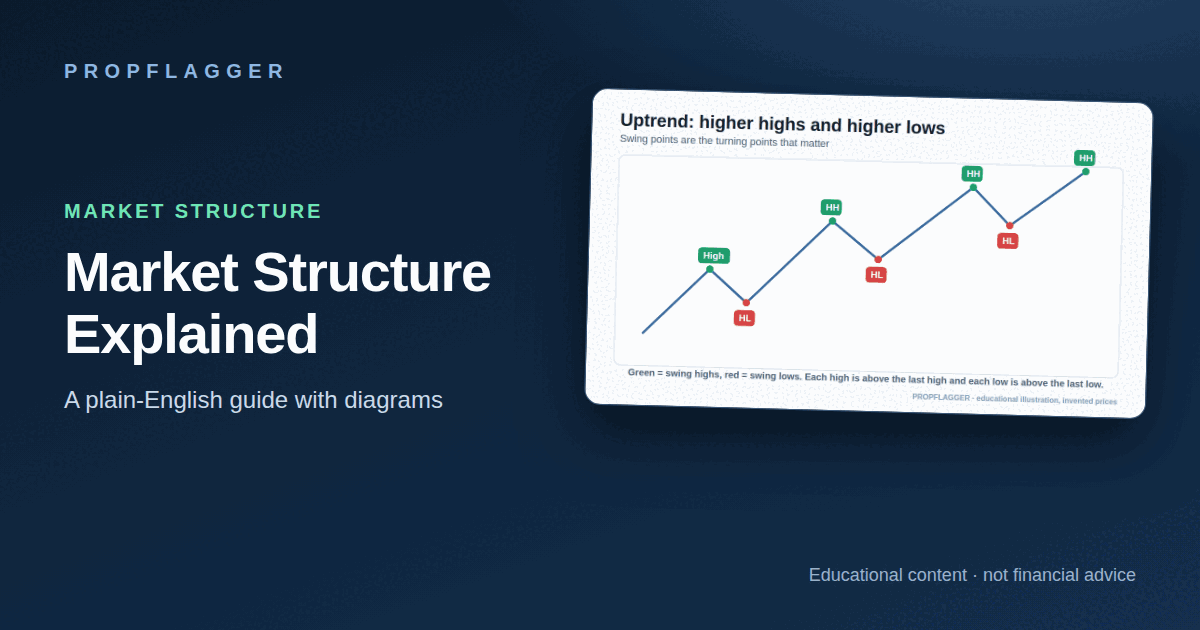
Market Structure Explained: Highs, Lows, BOS and CHoCH (featured illustration)

Quick answer

Market structure is the pattern of swing highs and swing lows that price makes. An uptrend makes higher highs and higher lows, a downtrend makes lower highs and lower lows, and a range moves between a high and a low. A break of structure (BOS) continues the trend; a change of character (CHoCH) is the first break against it. Both describe the chart, they do not predict it.

Key takeaways

  • Structure is built from swing highs and swing lows.
  • Uptrend: higher highs and higher lows. Downtrend: lower highs and lower lows.
  • BOS means the trend continued; CHoCH means the first break against it.
  • Definitions of a “swing” differ between traders, so write yours down.

What is market structure?

Market structure is the shape that price draws as it moves: a series of peaks (swing highs) and troughs (swing lows). Reading it answers a basic question before any trade idea: is the market going up, down or nowhere?

The idea goes back to Dow Theory, which describes trends as sequences of rising or falling highs and lows. Modern price-action traders added the terms BOS and CHoCH to describe when that sequence continues or breaks.

How do you read an uptrend?

An uptrend is a series of higher highs (HH) and higher lows (HL). Buyers push price above the last peak, sellers pull it back, but not as far down as the previous pullback.
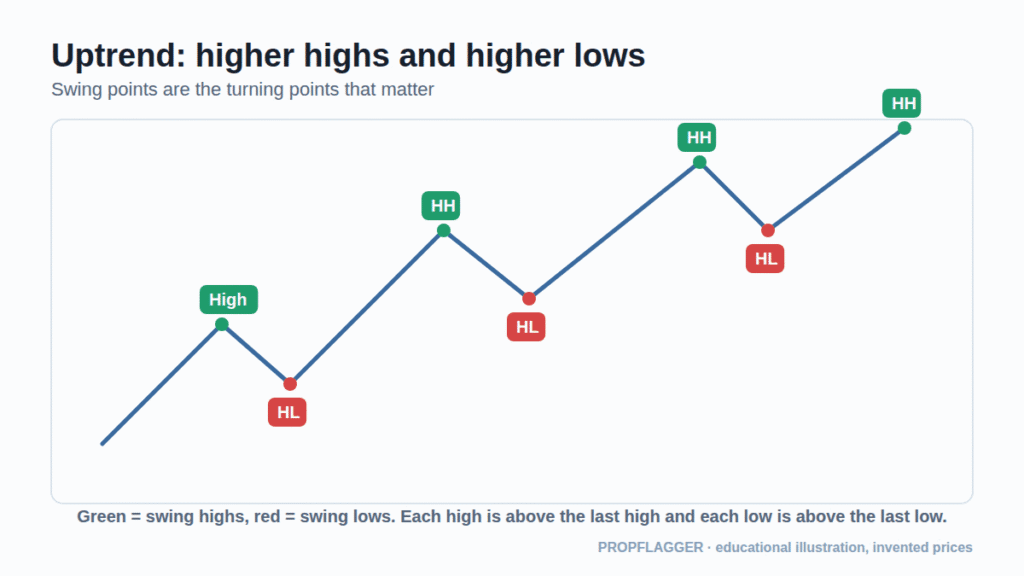
Line chart of an uptrend with higher highs and higher lows labelled
An uptrend: every swing high and swing low is higher than the previous one.

A downtrend is the mirror image: lower highs (LH) and lower lows (LL).

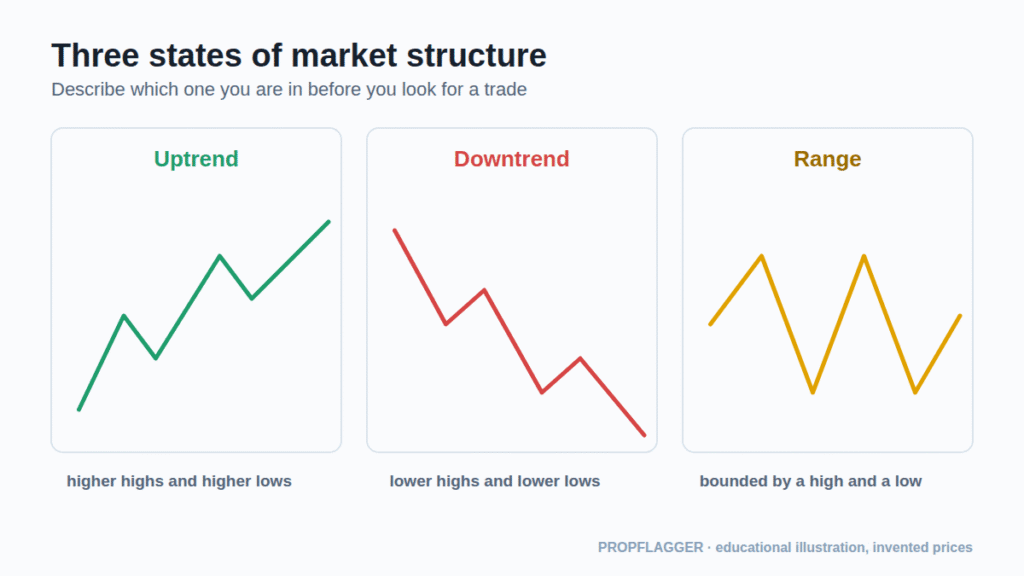
What are the three states of market structure?
Three small charts showing an uptrend, a downtrend and a range
The three states of structure.
Trend, downtrend and range
State Pattern What traders often do
Uptrend Higher highs and higher lows Look for pullbacks that hold above the last higher low
Downtrend Lower highs and lower lows Look for rallies that fail below the last lower high
Range Repeated highs and lows inside a band Respect the edges; wait for a clear break or rejection

What is a break of structure (BOS)?

A break of structure occurs when price breaks the latest swing point in the direction of the existing trend. In an uptrend, price closing above the previous swing high is a BOS. It shows that the trend is continuing.

What is a change of character (CHoCH)?

A change of character is the first break against the prevailing trend. In an uptrend it is price breaking below the most recent higher low, the very low that was keeping the series of higher lows intact.
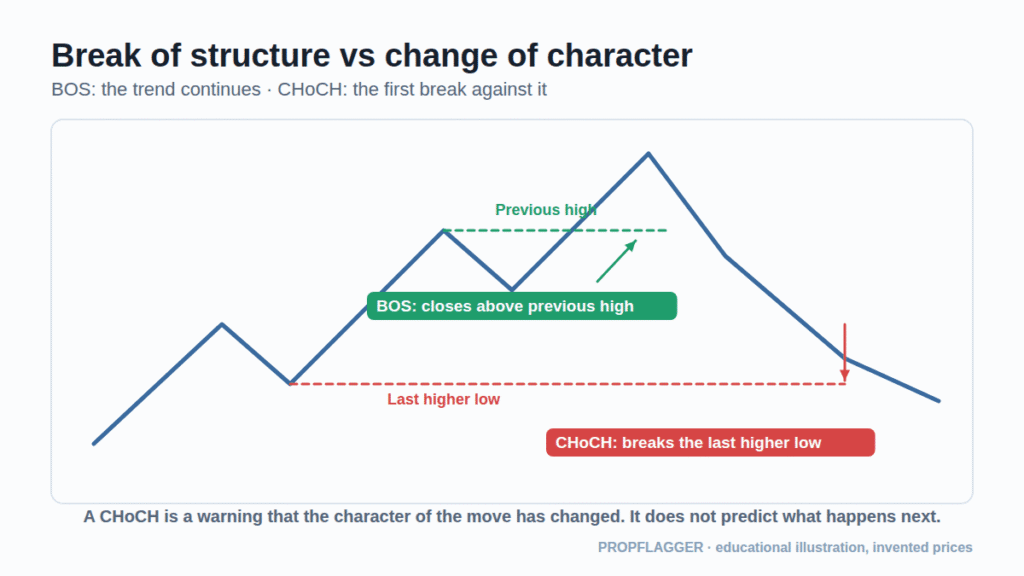
Diagram showing a break of structure above a previous high and a change of character below the last higher low
BOS confirms the trend; CHoCH is the first structural break against it.

Think of BOS as “the pattern is intact” and CHoCH as “the pattern just broke”. A CHoCH is not a sell signal and not proof of a reversal. After it, price can reverse, build a range or recover. It is useful because it tells you the original idea has weakened.

Which timeframe’s structure matters?

Structure exists on every timeframe, and they can disagree. A common approach is to read the higher timeframe for the main direction and use the lower timeframe to find a trade within it. For example, the daily chart may be in an uptrend while a five-minute chart shows a pullback. See how to read a price chart for the top-down routine.

How do structure and liquidity fit together?

Swing highs and lows are also the places where stops and breakout orders gather. That is why many traders watch what happens when price reaches a swing point: does it break and hold (acceptance), or does it poke through and come back (a sweep)? The liquidity guide explains the difference.

Common mistakes with market structure

  • Changing the definition mid-trade: if a “swing” gets smaller whenever it suits you, you are fitting the story.
  • Calling every wick a CHoCH: use closes and a consistent rule.
  • Ignoring the bigger picture: a CHoCH on a minute chart inside a strong daily trend is often just noise.
  • Using structure without risk limits: every read can be wrong, so decide the stop and the size first.

Using structure in a journal checklist

Structure works well as checklist items: “higher timeframe trend identified”, “latest swing point marked”, “CHoCH confirmed by a close”. On PropFlagger each journal entry records whether each of these was present, and the strategy modules show how a CHoCH is marked by hand on the annotated chart. Seeing the checklist beside the result makes it easier to tell a good process from a lucky outcome.

Educational content only. Nothing here is a recommendation to buy or sell anything.

Key terms

Swing high / swing low
A high (or low) with lower highs (or higher lows) on both sides of it.
BOS
Break of structure: price takes out the latest swing point in the direction of the trend.
CHoCH
Change of character: price breaks the swing point that kept the trend intact.
Range
A sideways market bounded by a high and a low.

Frequently asked questions

What is market structure in trading?

Market structure is the sequence of swing highs and swing lows on a chart. It tells you whether price is trending up, trending down or moving sideways, and it gives objective points where a trend idea would be wrong.

What is the difference between BOS and CHoCH?

A break of structure (BOS) happens when price breaks the latest swing point in the direction of the existing trend, so the trend continues. A change of character (CHoCH) is the first break of a swing point against the trend, such as price falling below the last higher low in an uptrend.

Does a CHoCH mean the trend has reversed?

Not necessarily. It is an early warning that the character of the move has changed. Price may reverse, move sideways or resume the old trend. Traders usually wait for more evidence and define their risk before acting.

How do I identify swing highs and lows?

A simple rule is to mark a high with a lower high on each side of it, and a low with a higher low on each side. Many platforms offer a swing or fractal tool. Use the same definition on every chart so your reads stay consistent.

Is market structure the same on every timeframe?

No. A downtrend on a five-minute chart can sit inside an uptrend on a daily chart. That is why traders compare timeframes before deciding which structure matters for their trade.

Sources and further reading

  1. CrossTrade: market structure
  2. LuxAlgo: change of character
  3. Strike: Dow Theory, phases of a trend

External links open in a new tab. They are provided for reference and are not endorsements.

Last reviewed: . Written by the PropFlagger editor for education. Diagrams use invented prices. Nothing here is financial advice or a recommendation to trade.

Tags:

6 comments

Join the discussion

Your email address will not be published. Required fields are marked *

Comments are moderated. Please do not post trade signals, tips, links to paid groups, or claims of guaranteed returns.