

No claims, no guarantees. This article is my personal study and research, written for education. I am not claiming that any ICT model works, that it is profitable or that it will work for you. Nothing here is financial advice, a signal or a recommendation to trade. Trading carries a substantial risk of loss, and most retail traders lose money. Please read the full disclaimer.
Why did I research these 12 ICT models?
I kept running into the same names in trading communities: Silver Bullet, Judas Swing, Unicorn, Power of 3, the 2022 Model. People described them with great confidence and very different words. I wanted to know whether they were twelve different ideas or one idea wearing twelve names, so I wrote each one down in my own notes, drew it on a chart and compared the steps side by side.
ICT stands for Inner Circle Trader, the brand of Michael J. Huddleston. His concepts (fair value gaps, order blocks, liquidity, time-of-day windows) are the backbone of what many call Smart Money Concepts. I am not affiliated with him, I am not selling a course, and I am approaching this as a sceptic who wants to test things, not as a believer.
Here is my honest starting point: I am describing what the models say, and what I plan to test. I am not reporting results.
What building blocks do I need before the models make sense?
Every model below is built from a handful of parts. If these are fuzzy, the models sound like jargon. These are the parts, in the order they usually appear:
- Liquidity: resting orders (stops and breakout entries) clustered around obvious highs, lows and round numbers. I explain this in my liquidity guide.
- Liquidity sweep: price trades through that level and then fails to hold.
- Displacement: a strong, fast move away, usually with large candles.
- Market structure shift (MSS) or change of character (CHoCH): price closes through the swing point that was keeping the old trend intact (see market structure).
- An entry zone: a fair value gap, order block, breaker or Fibonacci band that price may retrace into.
- Time: some models only count inside certain hours.
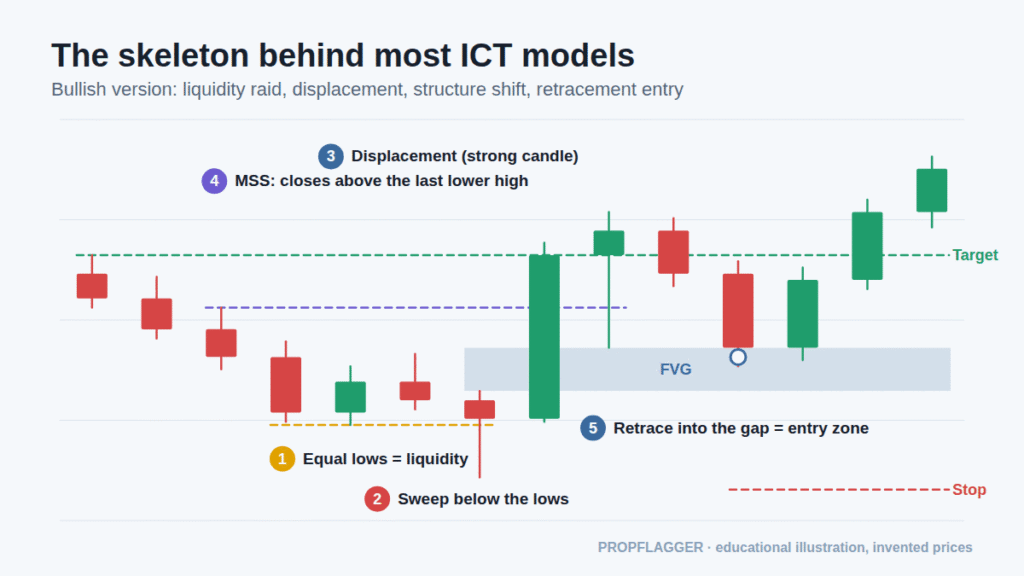
When I put the 12 models next to each other, this picture kept appearing. The differences are mostly about which entry zone and which clock window the author prefers.
What are fair value gaps, order blocks and breakers?
These three zones appear in more than half of the models, so I diagrammed them separately.
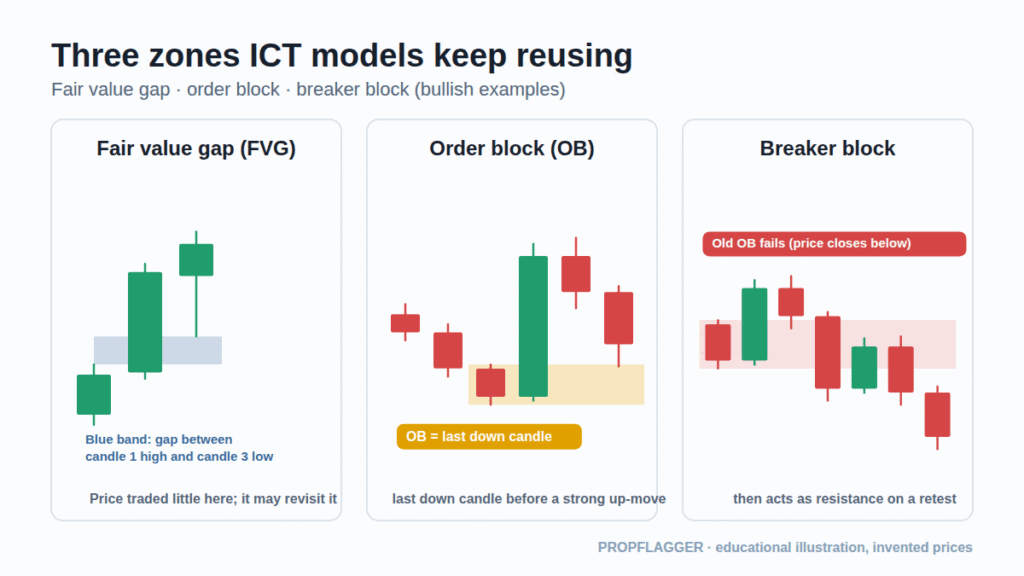
- Fair value gap (FVG): after a large middle candle, the first candle’s wick and the third candle’s wick do not overlap. That empty band is the gap. The idea is that price may return to it.
- Order block (OB): the last opposite-coloured candle before a strong move that breaks structure. A bullish OB is the last down-close candle before an impulsive rise.
- Breaker block: an order block that failed. Price closed through it, so the zone now works from the other side, like old support turning into resistance.
Definitions vary between teachers (some use the candle body, some the wicks), which is one reason I write down my own rule before I mark anything.
What are the 12 ICT models at a glance?
This is my summary table. The complexity score is my own rating of how many moving parts the model has, not a measure of quality.
| # | Model | Basic idea | Complexity (my rating) |
|---|---|---|---|
| 1 | ICT 2022 Model | Liquidity sweep → displacement → MSS/CHoCH → FVG/OB retracement entry | ⭐⭐⭐ |
| 2 | ICT Silver Bullet | Liquidity sweep → displacement → FVG entry within a specific 1-hour window | ⭐⭐ |
| 3 | ICT Judas Swing | Session-open false move/sweep → reversal → continuation in the intended direction | ⭐⭐ |
| 4 | ICT Power of Three / AMD | Accumulation → Manipulation → Distribution | ⭐⭐ |
| 5 | ICT Unicorn Model | Breaker block + FVG overlap | ⭐⭐⭐ |
| 6 | ICT Turtle Soup | False breakout/sweep of a previous high/low → reversal | ⭐⭐ |
| 7 | ICT OTE Model | Liquidity/structure setup → retracement into the 62–79% Fibonacci area | ⭐⭐ |
| 8 | ICT Market Maker Buy/Sell Model | Accumulation → manipulation → distribution structure applied directionally | ⭐⭐⭐⭐ |
| 9 | ICT Venom Model | Session/liquidity manipulation combined with displacement/FVG-type entry | ⭐⭐⭐ |
| 10 | ICT Breaker Model | Failed order block becomes a breaker and is retested | ⭐⭐⭐ |
| 11 | ICT FVG Entry Model | Displacement creates FVG → price retraces into FVG for entry | ⭐⭐ |
| 12 | ICT Order Block Entry Model | Liquidity/structure event → retracement into an Order Block | ⭐⭐ |
How does each of the 12 models work? My notes
1. ICT 2022 Model
This is the model I treat as the “full sequence”. As I read it: mark a liquidity target (such as a previous day high or low), wait for price to sweep it, look for displacement and an MSS or CHoCH on a lower timeframe, then wait for a retracement into the fair value gap or order block that displacement left behind. The stop sits beyond the sweep, and the target is the opposite liquidity.
What I would record: which level was swept, whether the MSS closed through the swing, and the planned stop and target before entry.
Full notes: my complete guide to the ICT 2022 Model →
2. ICT Silver Bullet
The Silver Bullet is the 2022 idea compressed into a clock. It uses three one-hour windows in New York time (3–4 AM, 10–11 AM and 2–3 PM). Inside a window, the model waits for a sweep or structure shift, then takes only a fair value gap that formed inside that hour. If no valid gap forms before the hour ends, the answer is no trade. I like that this makes it easy to audit, since it either happened in the window or it did not.
Full notes: my complete guide to the ICT Silver Bullet →
3. ICT Judas Swing
The name refers to a deceptive move. At a session open, price moves one way first (often sweeping a nearby high or low), then reverses and continues in the other direction. Some educators measure it from the New York midnight open and the first 15-minute range. My caution: with hindsight almost every session open contains a “Judas” move, so the rule needs to be written before the open.
Full notes: my complete guide to the ICT Judas Swing →
4. ICT Power of Three (AMD)
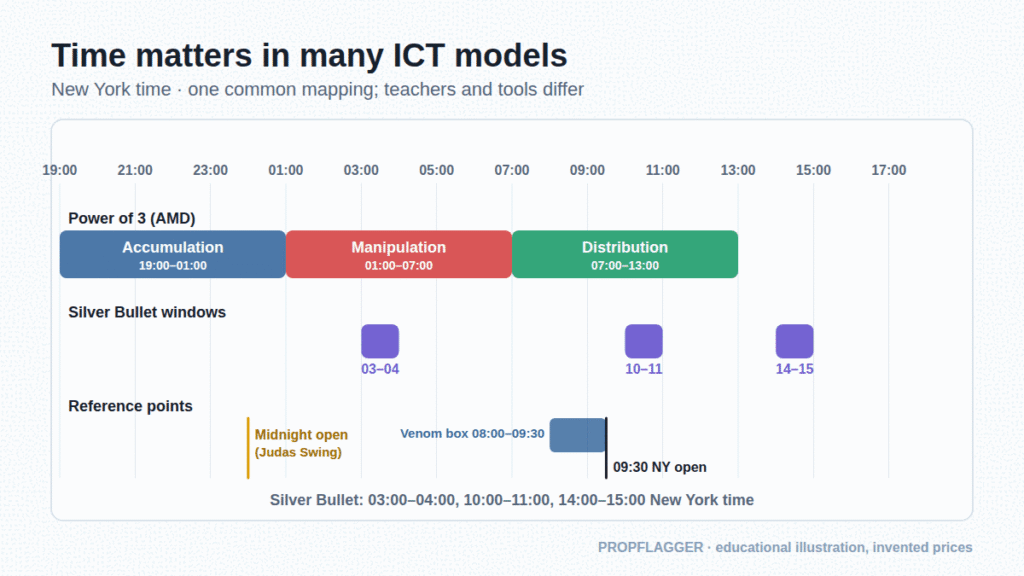
Power of Three splits a period into accumulation (a quiet range), manipulation (a false move that sweeps one side) and distribution (the real move). On a daily candle that looks like an open, a wick that runs one way, then a close in the opposite direction. One common mapping uses Asia as accumulation, London as manipulation and New York as distribution, but the clock windows differ between sources.
Full notes: my complete guide to the ICT Power of Three →
5. ICT Unicorn Model
A unicorn is a single confluence: a breaker block that overlaps a fair value gap. The sequence people describe is sweep, shift, overlap: price runs a swing level, displaces through structure, and the gap that the displacement leaves sits on top of the breaker. The overlap is the zone you would watch. I rate it three stars because it needs a failed order block and a gap in the same place.
Full notes: my complete guide to the ICT Unicorn Model →
6. ICT Turtle Soup
Turtle Soup is older than ICT. Laurence Connors and Linda Raschke published it in Street Smarts in the mid-1990s, named after the Turtle traders who bought 20-day breakouts. The original buy rule looks for a new 20-day low when the previous 20-day low is at least four sessions old, and enters when price trades back above that prior low, so it only triggers if the breakout is failing. The ICT version tells the same story in liquidity language, but it is discretionary and often asks for structure confirmation first.
Full notes: my complete guide to the ICT Turtle Soup →
7. ICT OTE Model
Optimal trade entry is a retracement band, roughly 61.8% to 79% of an impulse leg, with 70.5% (the midpoint) often marked. After a structure shift, the idea is to wait for price to pull back into that band so that a stop beyond the swing origin stays close.
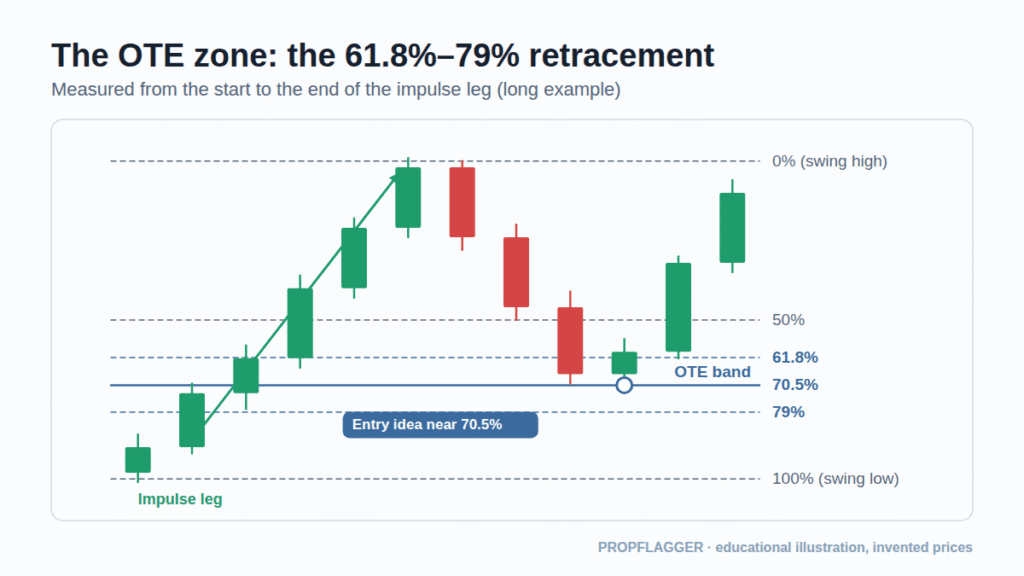
The Fibonacci band is simple to draw, which is also why it is easy to fit to the past. I would always anchor the leg by a written rule.
Full notes: my complete guide to the ICT OTE Model →
8. ICT Market Maker Buy/Sell Model
This is the biggest picture of the twelve, and the one I find hardest to apply. It describes a full delivery cycle in five stages: an original consolidation, a price run toward a liquidity objective, a smart-money reversal, a phase of accumulation or distribution, and completion. In the buy model, price works lower in steps, reverses at a sell-side objective and then retraces the whole path, so the consolidations it fell through become targets on the way back. The sell model mirrors it around a high.
Full notes: my complete guide to the ICT Market Maker Buy/Sell Model →
9. ICT Venom Model
The Venom Model is described by community educators as an intraday US-index model. A range called the “Venom box” forms before the New York open (08:00–09:30 in the descriptions I found). At 09:30 price is said to sweep the high or low of that box, then reverse, and the entry uses displacement and an FVG or MSS. I could not trace this one to a primary ICT source, so I treat it with extra caution.
Full notes: my complete guide to the ICT Venom Model →
10. ICT Breaker Model
The breaker model starts with an order block that fails: price closes through it, usually after a liquidity sweep. The old zone then flips and is retested from the other side. A bullish order block that is broken becomes a bearish breaker, so a rally back into it is where a short idea would be watched.
Full notes: my complete guide to the ICT Breaker Model →
11. ICT FVG Entry Model
The simplest of all: displacement leaves a fair value gap, price retraces into it, and the trade is taken at the gap with a stop on the other side of it. If a candle closes through the whole gap, the idea is treated as invalid. Because it is simple, it is also a good first thing to test.
Full notes: my complete guide to the ICT FVG Entry Model →
12. ICT Order Block Entry Model
After a liquidity or structure event, price retraces into an order block, the last opposite candle before the displacement. It is similar to the FVG entry, but the zone is a candle instead of a gap. I find it useful to log which of the two zones I used on each trade, so I can compare them later.
Full notes: my complete guide to the ICT Order Block Entry Model →
Where can I read each model in full?
I wrote a separate guide for every model, and each one links back here and to its neighbours. Start with whichever name you came across first:
- ICT 2022 Model
- ICT Silver Bullet
- ICT Judas Swing
- ICT Power of Three
- ICT Unicorn Model
- ICT Turtle Soup
- ICT OTE Model
- ICT Market Maker Buy/Sell Model
- ICT Venom Model
- ICT Breaker Model
- ICT FVG Entry Model
- ICT Order Block Entry Model
How do these 12 models relate to each other?
When I grouped them, three families appeared:
| Family | Models | What defines it |
|---|---|---|
| Sequence models | 2022 Model, Market Maker Buy/Sell, Turtle Soup | A multi-step story from raid to reversal |
| Time-based models | Silver Bullet, Judas Swing, Power of Three, Venom | The clock decides when the story counts |
| Entry-zone models | FVG, Order Block, Breaker, Unicorn, OTE | Where inside the retracement you enter |
The practical insight for me was that these are not twelve independent edges. If I test the 2022 Model with an FVG entry and the Silver Bullet in the same hour, many trades will overlap, and counting them as separate evidence would be fooling myself.
What order am I studying them in?
This is my own study order, not a recommendation: start with the parts (11 FVG entry, 12 order block), then the zone variants (7 OTE, 10 breaker, 5 unicorn), then the false-breakout ideas (6 Turtle Soup), then the time-based ones (2 Silver Bullet, 3 Judas Swing, 4 Power of Three, 9 Venom) and finally the long sequences (1 the 2022 Model, 8 Market Maker models). The sequence models make sense only after I can mark the parts reliably.
What time windows do the models use, and what are they in IST?
The time-based models use New York clock times. For an Indian reader the conversion changes twice a year with US daylight saving time:
| Window (New York) | IST in US daylight time (EDT) | IST in US standard time (EST) |
|---|---|---|
| 3:00–4:00 AM | 12:30–1:30 PM | 1:30–2:30 PM |
| 10:00–11:00 AM | 7:30–8:30 PM | 8:30–9:30 PM |
| 2:00–3:00 PM | 11:30 PM–12:30 AM | 12:30–1:30 AM |
These windows were built around forex and US index futures. NSE trades from 9:15 AM to 3:30 PM IST, so they do not line up. Anyone applying the same ideas to Nifty has to define their own windows, and then those windows are hypotheses I would need to test, not rules.
What does the evidence say about ICT?
I looked for hard evidence and I want to be straight about what I found:
- No audited track record. I found no independent, audited performance record for the models or their creator. Critics in the systematic-trading community repeat this point.
- Mostly educator material. The explanations I found came from teaching libraries, indicator vendors and TradingView posts. They describe the models, but they do not test them.
- One preprint, not peer-reviewed. A 2023 OSF preprint by a student researcher tested the Power of 3 idea on 14 forex pairs over 21 years and reported encouraging results. It is a useful starting point, but it has not been peer-reviewed, so I would not rely on it.
- Subjectivity. BabyPips notes the methods are still subjective, which makes consistent profitability harder to demonstrate even if the rules are clear enough to build systems from.
The wider context is sobering: SEBI’s study of individual traders in equity F&O found that about 93% had net losses over FY22–FY24 (and around 91% in FY25). A popular framework does not change those odds by itself.
How would I test one of these models honestly?
- Write the rule first. Define the sweep, the displacement, the MSS and the zone in one paragraph. If I cannot write it, I cannot test it.
- Use a checklist. Every item is yes or no. On this site that is the Strategy Match: how many criteria were present, kept separate from the result.
- Pre-decide risk. Fixed small risk per trade and a stop beyond the sweep (see risk management).
- Log everything. Original and annotated chart, level marked before the move, result in R, and whether the plan was followed (see how to keep a trading journal).
- Collect at least 30 to 100 trades on paper or with tiny size before reading anything into the numbers.
- Count overlapping trades once. A Silver Bullet that is also a 2022 Model is one trade, not two.
- Include costs and slippage, and avoid hindsight (see types of trading strategies for backtesting traps).
My own rule: until the journal shows a positive average R over a meaningful sample after costs, I treat these as ideas I am studying, not as a way to make money.
What is my takeaway so far?
The ICT models gave me a useful vocabulary for describing what price does around liquidity and imbalance. Whether that vocabulary produces a profitable edge is a different question, and one only a large honest sample can answer. The twelve names are far fewer ideas than they look like, the time windows are a strong filter if you believe them and an easy way to overfit if you do not, and every model needs the same boring things: a written rule, small risk and a journal.
Reminder: these are my study notes, not recommendations. I make no claim or guarantee of profit or success from any model described here. Past examples are invented or illustrative, and any real results will differ. If you choose to trade, you are responsible for your own decisions and risk.


7 comments