

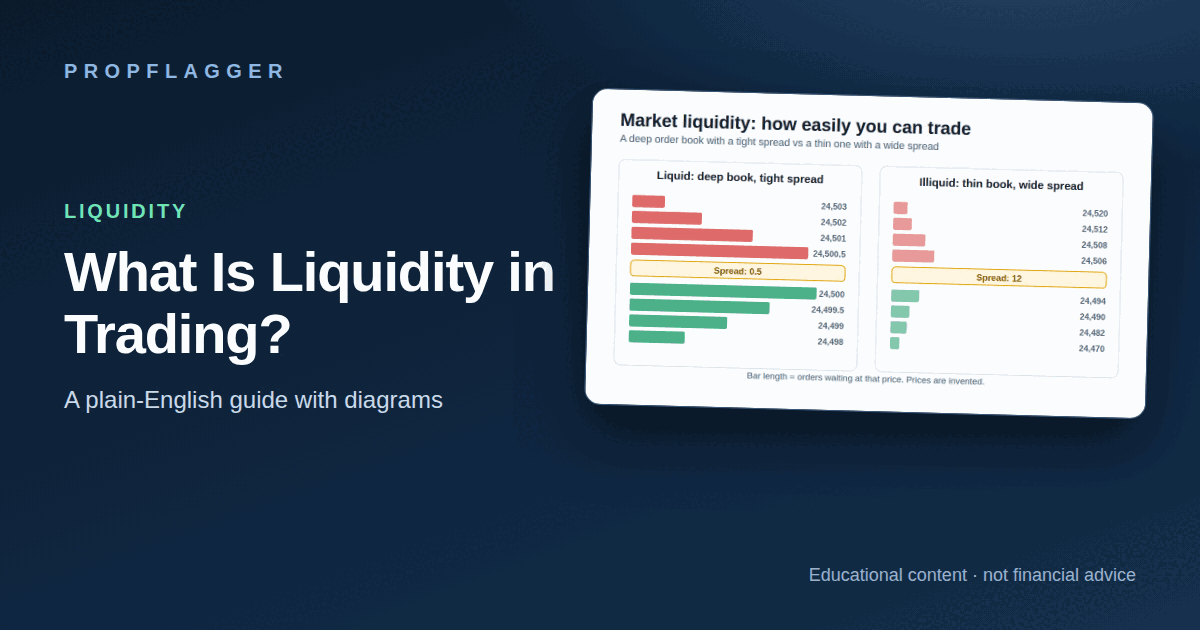
What does liquidity mean in trading?
In everyday markets, liquidity means how easily you can turn an asset into cash, or cash into the asset, without changing its price much. A large, actively traded stock index is liquid. A rarely traded contract is not.
Traders also use the same word in a second, narrower way: liquidity as clusters of orders sitting at obvious prices. The two meanings are related but different, so this guide covers both.
How do you tell if a market is liquid?
Three things show it quickly: the spread, the depth and the volume.
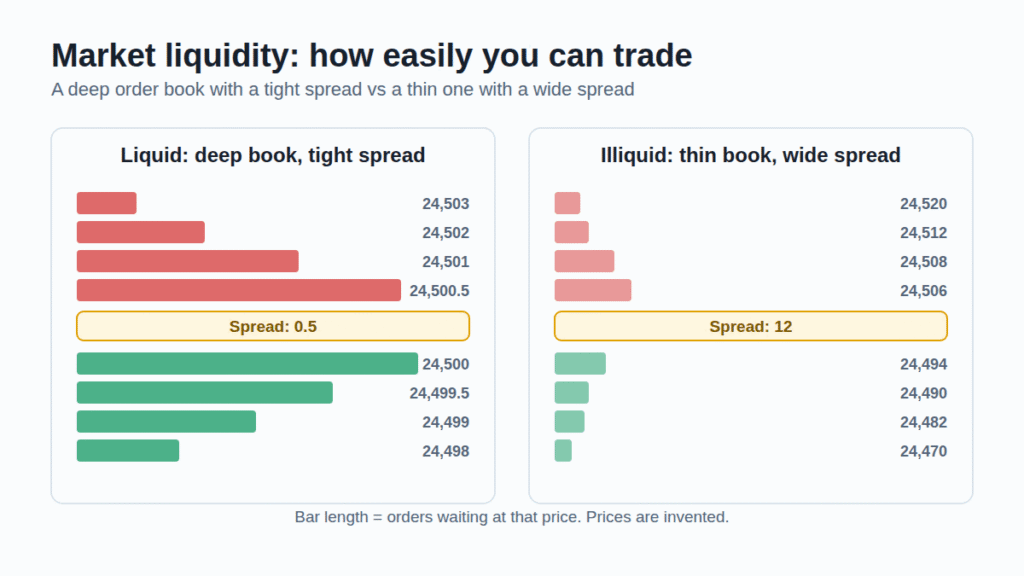
| Feature | Liquid | Illiquid |
|---|---|---|
| Bid-ask spread | Narrow | Wide |
| Order book depth | Large size close to the price | Thin, with gaps between prices |
| Slippage | Small | Can be large |
| Cost to trade | Lower | Higher |
The practical lesson is simple: before you plan a trade, check what it costs to get in and out. A wide spread is a cost you pay on every round trip.
What is a liquidity pool?
When thousands of traders read the same chart, they place orders in similar places. Stop-losses tend to sit just below obvious swing lows and just above obvious swing highs. Breakout traders place entry orders just beyond the same levels. These clusters are often called liquidity pools.
Common places include:
- Equal highs and equal lows: two or more touches of almost the same price.
- Previous day or session highs and lows.
- Round numbers.
- Obvious swing highs and lows.
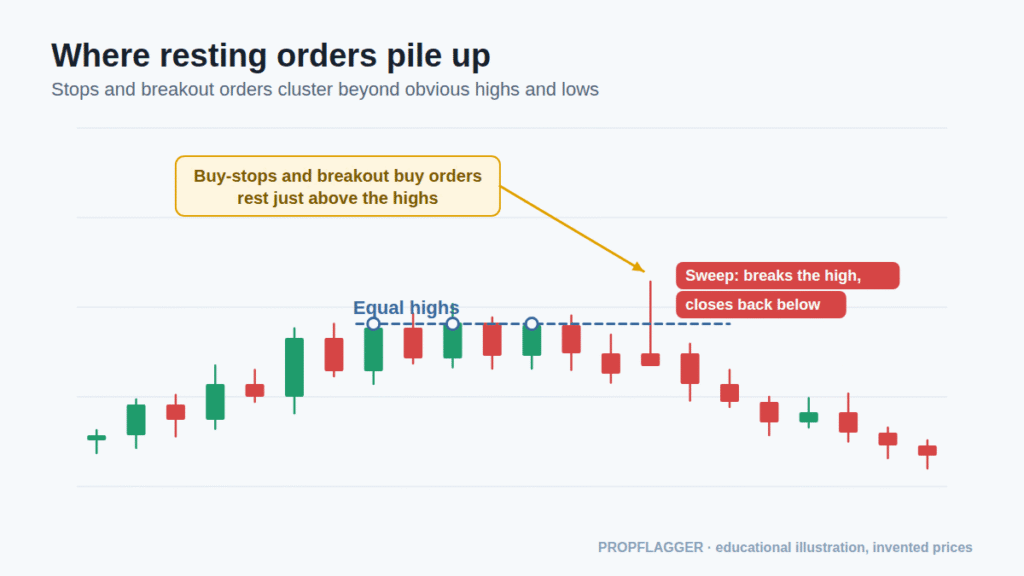
The reasoning is that an order needs a counterparty. A cluster of buy-stops above a high is a place where there is plenty of activity if price gets there.
What is a liquidity sweep?
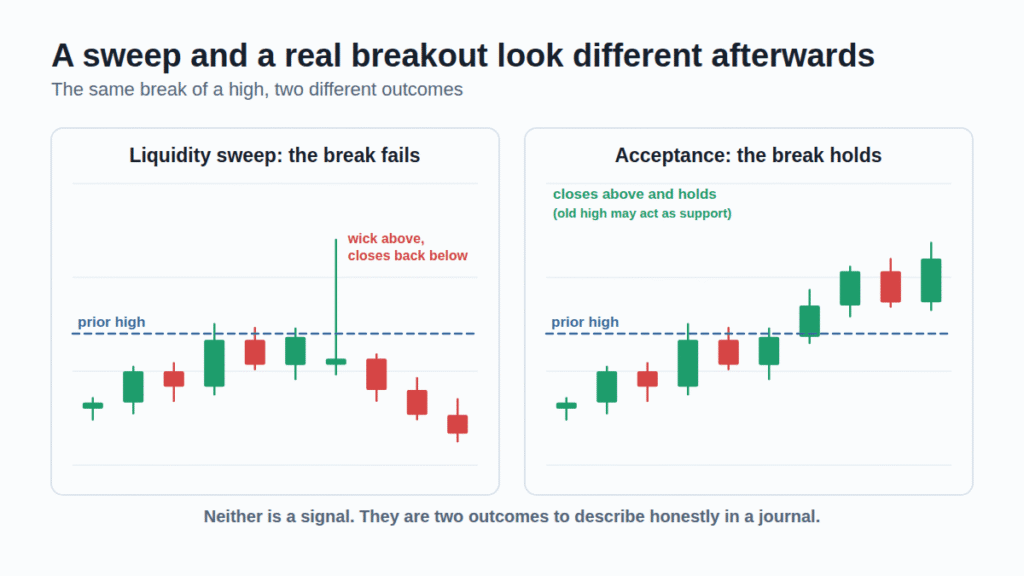
A liquidity sweep is a move through one of those levels that does not hold. Price trades beyond the high or low, triggers the resting orders, and then returns back inside the previous range, often leaving a long wick.
It is not the same as a normal breakout. After a breakout, price stays beyond the level and may retest it as support or resistance. After a sweep, price closes back on the other side.
Some traders look for a sweep followed by a break of structure as one of the conditions for an idea. Whether it works for you is something only your own records can answer. See market structure for how break of structure and change of character are defined.
Is it a stop hunt?
You will often see sweeps described as “stop hunts” by large players. From a chart alone you cannot know whether anyone targeted anything, or whether price simply ran out of buyers. A neutral way to use the idea is:
- Expect orders to cluster at obvious levels.
- Be careful about putting your own stop exactly there.
- Judge a trade by what price does after the level is taken, not by the story about why.
What can go wrong?
- Seeing sweeps everywhere: with hindsight almost every wick looks like one. Mark levels before the move.
- Ignoring spread and slippage: fast markets and thin instruments make fills worse than planned.
- Trading illiquid instruments with large size: your own order can move the price.
- Treating the model as a rule: sweeps fail too. Define where the idea is wrong and risk a small, fixed amount (see risk management).
How to record liquidity ideas in a journal
If you trade with these ideas, write the level down before the trade, note whether price swept it, and save a chart. After 30 or more entries you can see whether sweeps at the levels you mark actually led to better outcomes for you, or only look good in hindsight.
Educational content only. It describes concepts used by some traders and is not a recommendation to trade.
6 comments