
Trading Strategies

ICT Judas Swing Explained: The False Move at the Session Open

A Judas Swing is a deceptive early move at a session open that reverses. Here is how it is defined, how I would mark it before the open, and why hindsight makes it look easier than it is.

ICT Judas Swing Explained: The False Move at the Session Open (featured illustration)

Quick answer

In ICT terms, a Judas Swing is a false move early in a session, usually measured from the New York midnight open, that runs stops on one side before price reverses and moves the other way. A bullish version dips below the open, then reverses up; a bearish version spikes above, then falls. It is only visible afterwards, so I treat it as a hypothesis, not a signal.

Key takeaways

  • It is a false move at the open that reverses; the open is usually the New York midnight open.
  • Sources place it between midnight and about 5:00 AM New York time.
  • It is confirmed only after the reversal, which makes hindsight a big risk.
  • I would write the rule (which open, which range) before the session starts.

No claims, no guarantees. These are my personal study notes, written for education. I am not claiming that this model works, that it is profitable or that it will work for you. Nothing here is financial advice, a signal or a recommendation to trade. Trading carries a substantial risk of loss, and most retail traders lose money. See the full disclaimer.

What is the ICT Judas Swing?

The name comes from the idea of a betrayal: price makes a convincing move one way at the start of a session, then reverses and goes the other way. In my ICT research notes it is one of four models that depend mainly on time, together with the Silver Bullet, Power of Three and Venom.

How is it measured?

The usual reference is the New York midnight open, drawn as a horizontal line. A bullish Judas swing is a push below that line, followed by a reversal and a close back above. A bearish one is a push above, then a reversal and a close back below.
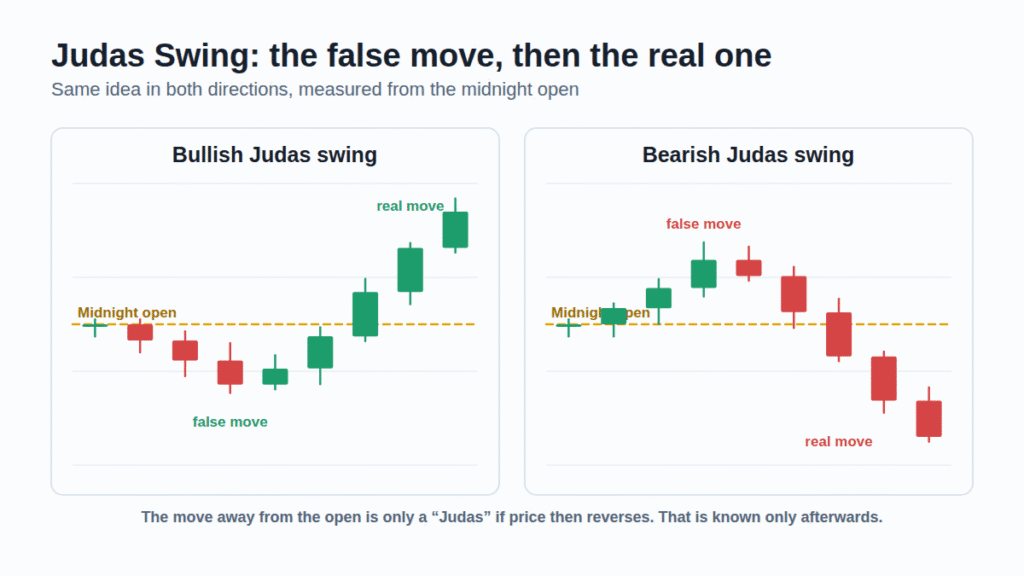
Two small charts showing a bullish Judas swing that dips below the midnight open and reverses up, and a bearish one that spikes above and falls
Bullish and bearish Judas swings measured from the midnight open (invented prices).

One indicator I read about uses the first 15-minute range after midnight and waits for price to touch one side, then the other, and then break back through. Different teachers use different anchors, so I treat the anchor as a parameter to be fixed in advance.

When is it supposed to appear?

The descriptions I found place it between midnight and roughly 5:00 AM New York time, frequently around the London open at 3:00 AM.
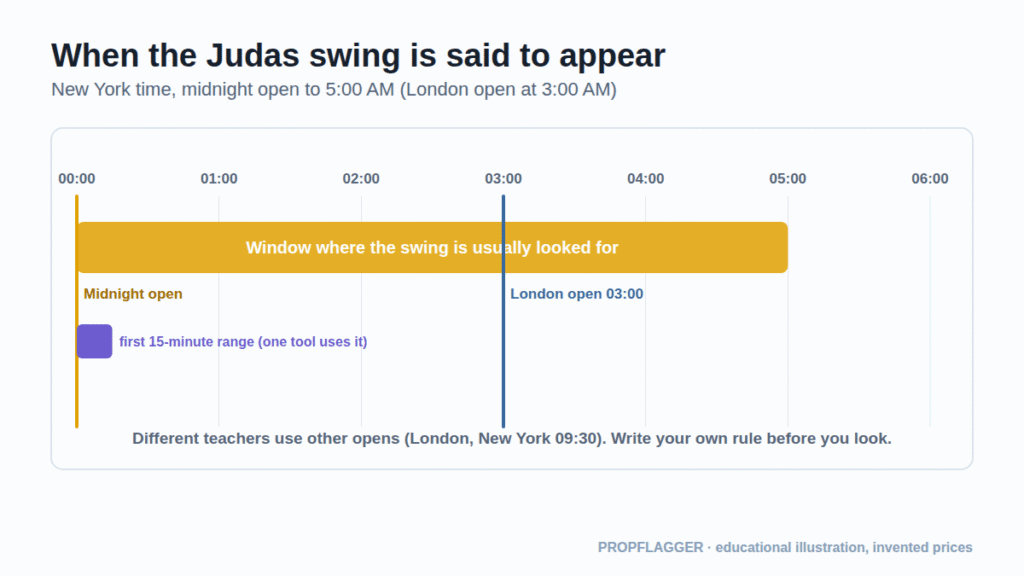
Timeline from midnight to 6 AM New York time showing the window where the Judas swing is looked for and the London open at 3 AM
The window where the swing is usually looked for.

For an Indian reader that is roughly 9:30 AM to 2:30 PM IST while the US is on daylight time (add one hour in US standard time). Because Nifty’s session starts at 9:15 AM IST, a Nifty version of the idea needs its own definition, and that would be a new test, not a rule.

How would I write it as a checklist?

  1. Mark the midnight open and the previous day’s high and low before the session.
  2. Note whether price moved away from the open and took a marked level.
  3. Wait for displacement back through the open and a structure shift (see market structure).
  4. Plan the entry on a retracement into the gap or order block (see FVG entry).
  5. Stop beyond the false-move extreme; target the liquidity on the other side. In some descriptions that is the opposite session high or low.

What are the weak points?

  • Hindsight: almost every open has a move that looks like a Judas swing afterwards.
  • Several possible “opens”: midnight, London, New York 9:30. Choosing after the fact is overfitting.
  • Directional bias is assumed: without a bias, a false move cannot be told from a real breakout.
  • Costs: thin early-session liquidity can mean wide spreads (see liquidity).

How would I test it?

I would log every session open, including the ones without a swing, record which anchor I used, and measure results in R. Only after a large sample could I say whether “Judas” sessions behaved any differently from ordinary ones. The Power of Three notes show the bigger three-phase picture this swing belongs to.

Reminder: I make no claim or guarantee of profit or success from anything described here. Examples are invented or illustrative and real results will differ. If you choose to trade, you are responsible for your own decisions and risk.


Key terms

Midnight open
The price at 00:00 New York time, used as a reference line.
False move
A push away from the open that fails and reverses.
Liquidity
Resting orders just beyond obvious highs and lows.

Frequently asked questions

What is the ICT Judas Swing?

It is ICT’s name for a false move early in a session. Price pushes one way shortly after an open, takes resting stops, then reverses and develops in the other direction. The “Judas” label refers to the deception.

When does the Judas Swing happen?

Sources describe it between the New York midnight open (00:00) and about 5:00 AM New York time, often around the London open at 3:00 AM. Other teachers measure it from the New York 9:30 open instead.

What is the difference between the Judas Swing and Power of Three?

Power of Three describes the whole period in three phases. The Judas Swing is the manipulation phase of that picture, the false move against the eventual direction.

How can I tell it is a Judas Swing in real time?

You usually cannot. It is confirmed only when price reverses and closes back through the open or a swing. That is why I would only act on a rule written beforehand, such as a structure shift after the false move.

Does the Judas Swing work?

I do not know, and I found no independent test. Many session opens contain a move that can be labelled a Judas swing in hindsight, so a fair test needs a written rule and a large sample.

Sources and further reading

  1. LuxAlgo library: Judas Swing
  2. TradingView: Judas Swing ICT, New York midnight opening, M15 (TradingFinder)
  3. TradingView: Power of 3 (PO3) AMD blueprint

External links open in a new tab. They are provided for reference and are not endorsements.

The ICT models series

My research notes on twelve ICT models. Each guide stands alone and links to its neighbours.

  1. Overview: all 12 models
  2. 2022 Model
  3. Silver Bullet
  4. Judas Swing
  5. Power of Three
  6. Unicorn Model
  7. Turtle Soup
  8. OTE Model
  9. Market Maker Model
  10. Venom Model
  11. Breaker Model
  12. FVG Entry
  13. Order Block Entry

Last reviewed: . Written by the PropFlagger editor for education. Diagrams use invented prices. Nothing here is financial advice or a recommendation to trade.

Tags:

2 comments

Join the discussion

Your email address will not be published. Required fields are marked *

Comments are moderated. Please do not post trade signals, tips, links to paid groups, or claims of guaranteed returns.