
Trading Strategies

ICT Power of Three (AMD) Explained: Accumulation, Manipulation, Distribution

Power of Three splits a period into accumulation, manipulation and distribution. Here is how it maps to a daily candle and to Asia, London and New York, and why bias matters.

ICT Power of Three (AMD) Explained: Accumulation, Manipulation, Distribution (featured illustration)

Quick answer

The ICT Power of Three, or AMD, describes a period in three phases: accumulation (a quiet range near the open), manipulation (a false move that sweeps one side) and distribution (the real move). On a daily candle that looks like an open, a wick against the intended direction, then a close in the intended direction. It is a description of a pattern, not a prediction, and I make no claim that it works.

Key takeaways

  • PO3 = accumulation, manipulation, distribution.
  • A sweep of a high suggests a bearish PO3; a sweep of a low suggests a bullish PO3.
  • One common mapping: Asia = accumulation, London = manipulation, New York = distribution.
  • It only helps if the bias is written before the manipulation phase.

No claims, no guarantees. These are my personal study notes, written for education. I am not claiming that this model works, that it is profitable or that it will work for you. Nothing here is financial advice, a signal or a recommendation to trade. Trading carries a substantial risk of loss, and most retail traders lose money. See the full disclaimer.

What is the ICT Power of Three?

Power of Three (PO3), also written AMD, is a way to describe a period of time in three acts: accumulation, manipulation and distribution. I think of it as the simplest story behind many ICT models, and it appears in my ICT research notes as one of the four time-based ones.

How does PO3 look on a daily candle?
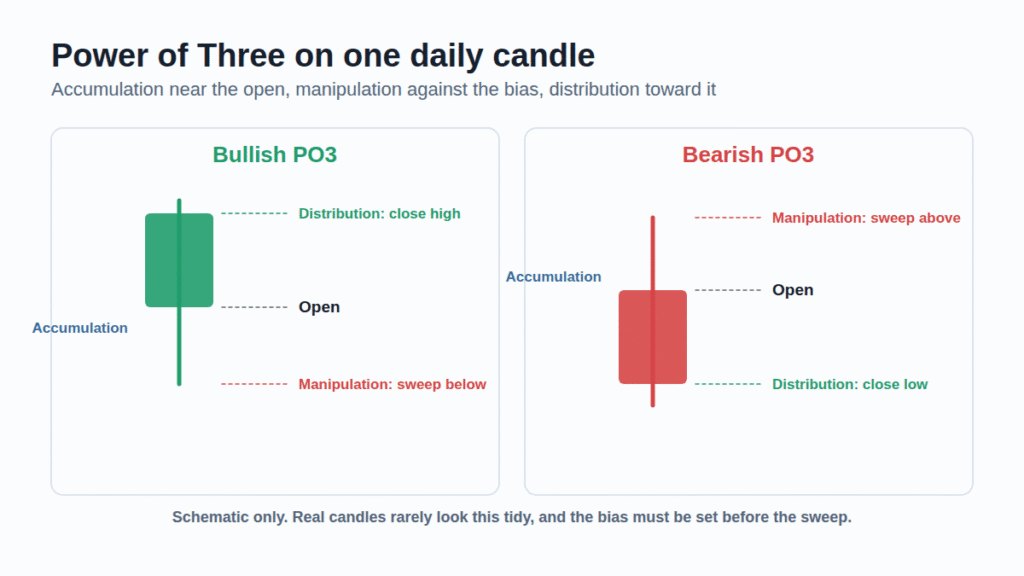
Bullish and bearish daily candle schematics showing accumulation, manipulation and distribution relative to the open
PO3 on a single daily candle (schematic).
  • Accumulation: a quiet range around the open while orders build up.
  • Manipulation: a move against the eventual direction that sweeps one side of the range.
  • Distribution: the expansion toward the real direction, usually the candle’s close.

In the descriptions I read, a sweep of a high before a move down suggests a bearish PO3, and a sweep of a low before a move up suggests a bullish one. The problem is obvious: the direction is only known after the sweep. That is why I would write my bias before the session.

How does it map to Asia, London and New York?

A common approach treats the Asian session as accumulation, London as manipulation and New York as distribution. One indicator I looked at uses fixed clock windows (19:00–01:00, 01:00–07:00, 07:00–13:00 New York time), but other sources shift them.
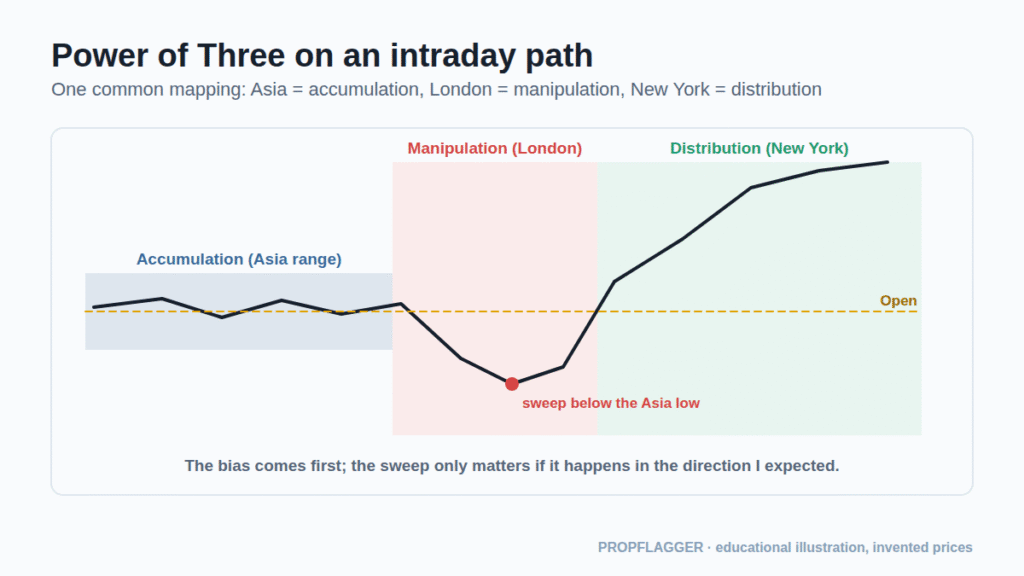
Intraday price path with the Asia range as accumulation, a London sweep as manipulation and a New York rally as distribution
One common intraday mapping of the three phases.

The manipulation phase is what the Judas Swing describes. The same three acts, stretched into a five-stage cycle, are the Market Maker models.

Is there a weekly version?

Some educators apply the same idea to a week, anchored on the weekly open. I read claims that in a bullish week the low often forms around Tuesday or Wednesday, but I have not verified them, so I keep them as questions for my journal rather than facts.

How would I use it without fooling myself?

  1. Decide the bias first from higher-timeframe structure (see market structure).
  2. Mark the range that counts as accumulation and write down its high and low.
  3. Wait for a sweep in the direction opposite to my bias, not in the same direction.
  4. Use an entry model such as a fair value gap entry, with the stop beyond the manipulation extreme.
  5. Log it, including days where the sweep happened in my bias direction (which means the model did not apply).

What does the evidence say?

I found one 2023 OSF preprint by a student researcher testing PO3 on 14 forex pairs over 21 years, with encouraging conclusions. It is not peer-reviewed and I could not reproduce it, so I do not rely on it. The wider caution: retail results are poor in general. SEBI’s study of individual F&O traders found about 93% had net losses over FY22–FY24.

What are the main risks?

  • Labelling after the fact: any day can be described as AMD once you know how it ended.
  • Window mining: shifting the session boundaries until the pattern fits.
  • Trend days: when price trends from the open there is no manipulation phase, and a PO3 trade would be wrong.

Reminder: I make no claim or guarantee of profit or success from anything described here. Examples are invented or illustrative and real results will differ. If you choose to trade, you are responsible for your own decisions and risk.


Key terms

Accumulation
A quiet range where orders build up.
Manipulation
A false move that sweeps one side of the range.
Distribution
The expansion in the intended direction.

Frequently asked questions

What is the ICT Power of Three?

It is a framework that splits a trading period into three phases: accumulation, manipulation and distribution (AMD). It is taught by Michael Huddleston as a way to describe how a candle or a session forms.

What times does the Power of Three use?

Sources differ. One common mapping treats Asia as accumulation, London as manipulation and New York as distribution. One indicator uses 19:00–01:00, 01:00–07:00 and 07:00–13:00 New York time. Treat the windows as parameters, not facts.

How do I know whether the PO3 is bullish or bearish?

In the descriptions I found, a sweep of a high before a move down suggests a bearish PO3, and a sweep of a low before a move up suggests a bullish PO3. That is only known after the sweep, so a bias set in advance is essential.

Is there evidence for the Power of Three?

I found one non-peer-reviewed 2023 student preprint on forex pairs that reported encouraging results, but nothing audited or peer-reviewed. I treat it as an idea to test, not as proof.

How is PO3 related to the Judas Swing?

The Judas Swing is essentially the manipulation phase: the false move against the eventual direction near the start of the day.

Sources and further reading

  1. TradingView: Power of 3 (PO3) — the institutional AMD blueprint
  2. Backtrex: ICT Power of Three (AMD) strategy
  3. Agarwal (2023), OSF preprint: validity of ICT Power of 3 in forex (not peer-reviewed)

External links open in a new tab. They are provided for reference and are not endorsements.

The ICT models series

My research notes on twelve ICT models. Each guide stands alone and links to its neighbours.

  1. Overview: all 12 models
  2. 2022 Model
  3. Silver Bullet
  4. Judas Swing
  5. Power of Three
  6. Unicorn Model
  7. Turtle Soup
  8. OTE Model
  9. Market Maker Model
  10. Venom Model
  11. Breaker Model
  12. FVG Entry
  13. Order Block Entry

Last reviewed: . Written by the PropFlagger editor for education. Diagrams use invented prices. Nothing here is financial advice or a recommendation to trade.

Tags:

2 comments

Join the discussion

Your email address will not be published. Required fields are marked *

Comments are moderated. Please do not post trade signals, tips, links to paid groups, or claims of guaranteed returns.