

Price Action

Price Action Trading for Beginners: Candles, Levels and Context

Price action means reading the chart’s own prices instead of relying on indicators. This guide covers levels, two candle patterns and the role of context.

Price Action Trading for Beginners: Candles, Levels and Context (featured illustration)

Quick answer

Price action is the study of how price itself moves on a chart, using candles, swing points and support and resistance rather than indicators. Common building blocks are key levels, candle patterns such as the pin bar and the engulfing candle, and the surrounding trend. A pattern only matters when it appears at a meaningful level and fits the context.

Key takeaways

  • Price action reads candles, swing points and levels directly, without indicators.
  • Support and resistance are zones, and broken levels often switch roles.
  • A pin bar shows rejection; an engulfing candle shows a shift in momentum.
  • The same pattern means different things at a level and in the middle of nowhere.

What is price action?

Price action is the movement of price over time, as drawn by candles on a chart. A price action trader reads that movement directly (swing points, candles, levels) instead of relying on a stack of indicators. It does not mean there is nothing else to learn: you still need a plan, risk limits and a way to review your results.

What are support and resistance?

Support is an area where falling price has paused or turned up in the past. Resistance is an area where rising price has paused or turned down. Treat them as zones, not exact lines, because price rarely turns at the same tick twice.

What is role reversal?

Once a level breaks decisively, it often switches jobs: broken resistance can become support, and broken support can become resistance. Traders watch the retest of the broken level to see whether it holds.
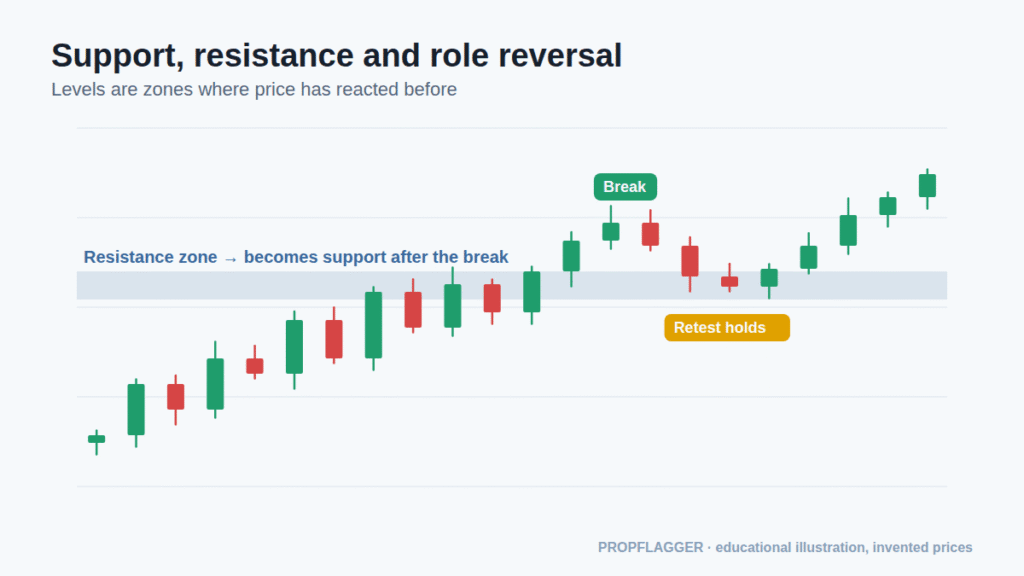
Candlestick chart where price breaks a resistance zone and later retests it as support
Role reversal: a broken resistance zone is retested and holds as support.

What is a pin bar?

A pin bar (pinocchio bar) is a candle with a long wick and a small body. A bullish pin bar has a long lower wick: price fell, buyers pushed it back up, and the candle closed near its high. A bearish pin bar is the reverse. The wick marks prices the market rejected.

What is an engulfing candle?

An engulfing candle is a candle whose body covers the previous candle’s body. A bullish engulfing candle is a green body that covers a red one. It shows that for that period buyers overwhelmed the previous selling.
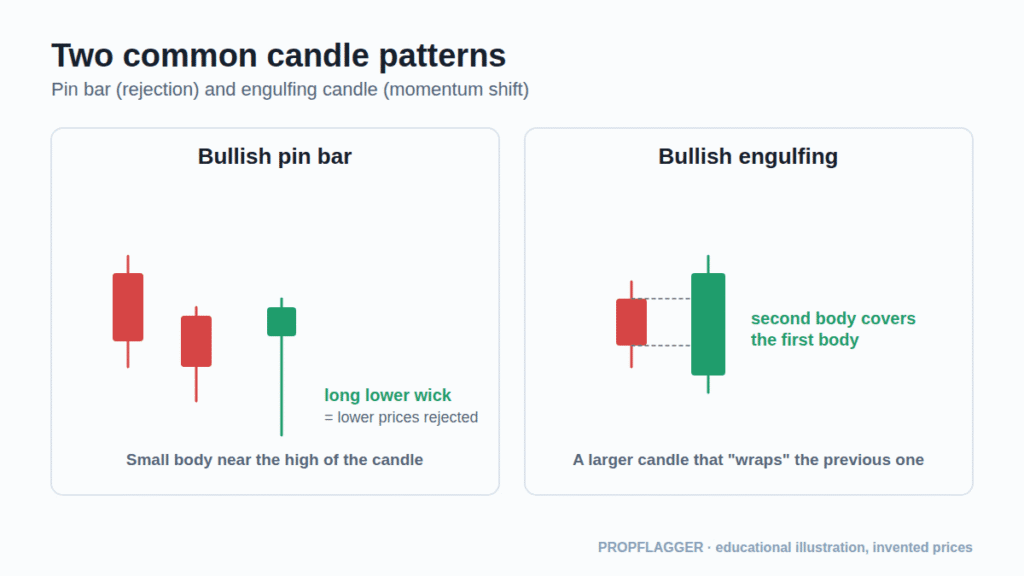
Diagram of a bullish pin bar and a bullish engulfing candle
Two common candle patterns.

Why does context matter more than the pattern?

A pin bar in the middle of a range tells you very little. The same pin bar at a level that has held before, in the direction of the higher-timeframe trend, tells you much more. Before you give a pattern any weight, ask:

  • Is it at a level I marked before the candle formed?
  • Does it agree with the trend on the higher timeframe?
  • Where would the idea be wrong, and is that close enough to risk a small amount?
  • Is there room before the next obvious level?
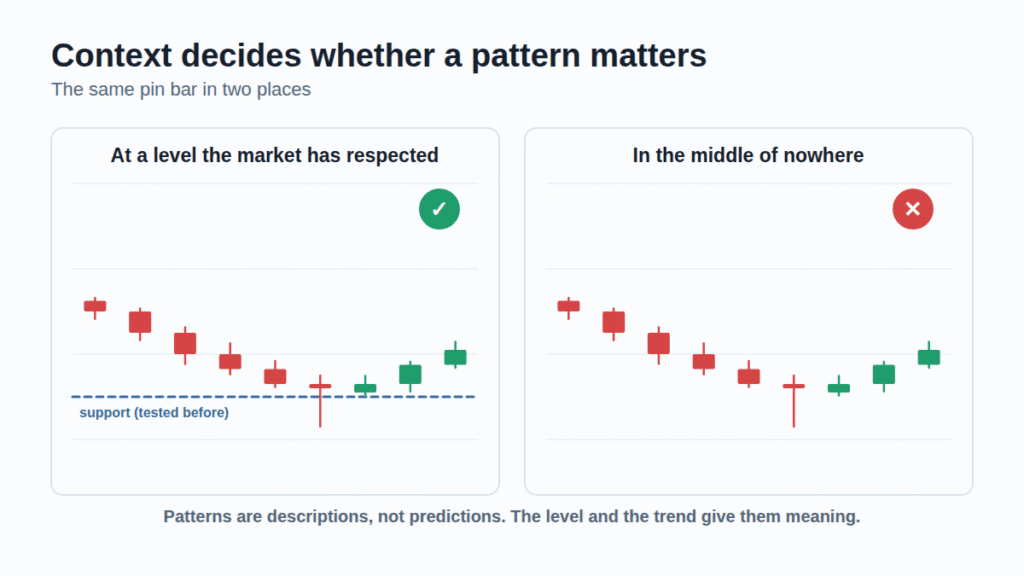
The same pin bar shown at a support level and in the middle of a range
Context: the same candle at a tested level and in no-man’s land.

A simple price-action checklist

  1. Identify the trend on the higher timeframe (see market structure).
  2. Mark the nearest significant support and resistance zones.
  3. Wait for price to reach a zone; do not chase it.
  4. Look for a rejection or momentum candle that closes.
  5. Place the stop where the idea is clearly wrong, then size the position from that distance (see risk management).
  6. Save the chart and write down why you took the trade.

Common price-action mistakes

  • Memorising patterns, ignoring levels. Patterns without a level are noise.
  • Entering on a candle that has not closed. The wick can disappear before the period ends.
  • Drawing hundreds of lines. If everything is a level, nothing is.
  • Judging patterns by a few memorable winners. Count all the instances, including the failures.

How do you test whether a pattern works for you?

Record every setup you take, with the level, the candle, the stop and the result in R. After at least 30 entries, separate the ones with a clear level from those without. Many traders discover that their results depend more on the level and the stop than on the exact candle shape. The trading journal guide shows what to capture.

Educational content only. Patterns describe past behaviour and do not predict future prices.
Key terms

Price action
Trading decisions based on the movement of price rather than indicators.
Pin bar
A candle with a long wick and a small body, showing rejection of a price area.
Engulfing candle
A candle whose body covers the body of the previous candle.
Role reversal
Old resistance becoming support, or old support becoming resistance.

Frequently asked questions

What is price action trading?

Price action trading is an approach that uses the movement of price on a chart (candles, swing highs and lows, and support and resistance) to make decisions, usually with few or no indicators. It focuses on what the market is doing now rather than on calculated signals.

What is a pin bar?

A pin bar is a candle with a long wick and a small body near one end. It shows that price travelled in one direction and was pushed back, so the market rejected that price area. It is more meaningful at an important level than in the middle of a range.

What is an engulfing candle?

An engulfing candle is one whose body completely covers the body of the previous candle. A bullish engulfing candle has a green body covering a prior red one, and shows buyers taking over from sellers for that period. It is not a guarantee of reversal.

Is price action better than using indicators?

Neither is better in general. Indicators are calculated from price, so price action is the raw material they come from. Price action traders prefer a cleaner chart; others use indicators to summarise trend or volatility. What matters is a tested, consistent process with controlled risk.

How reliable are candlestick patterns?

Patterns are descriptions of recent behaviour, not forecasts, and every pattern fails some of the time. Reliability depends on the instrument, timeframe and context, so the only honest answer comes from recording your own results over many trades.

Sources and further reading

  1. IC Markets: what is price action?
  2. TrueData: what is price action trading?
  3. Strike: Dow Theory and role reversal of support and resistance

External links open in a new tab. They are provided for reference and are not endorsements.

Last reviewed: . Written by the PropFlagger editor for education. Diagrams use invented prices. Nothing here is financial advice or a recommendation to trade.

Tags:

2 comments

Join the discussion

Your email address will not be published. Required fields are marked *

Comments are moderated. Please do not post trade signals, tips, links to paid groups, or claims of guaranteed returns.