


No claims, no guarantees. These are my personal study notes, written for education. I am not claiming that this model works, that it is profitable or that it will work for you. Nothing here is financial advice, a signal or a recommendation to trade. Trading carries a substantial risk of loss, and most retail traders lose money. See the full disclaimer.
What is the ICT Unicorn Model?
The unicorn is the model whose name made me smile and whose definition made me stop: it is just two zones that overlap. A breaker block and a fair value gap sit in the same price range, and that overlap is where an entry is planned. It is one of the twelve models in my ICT research notes, rated three stars for complexity because two separate conditions must coincide.
How does a unicorn form?
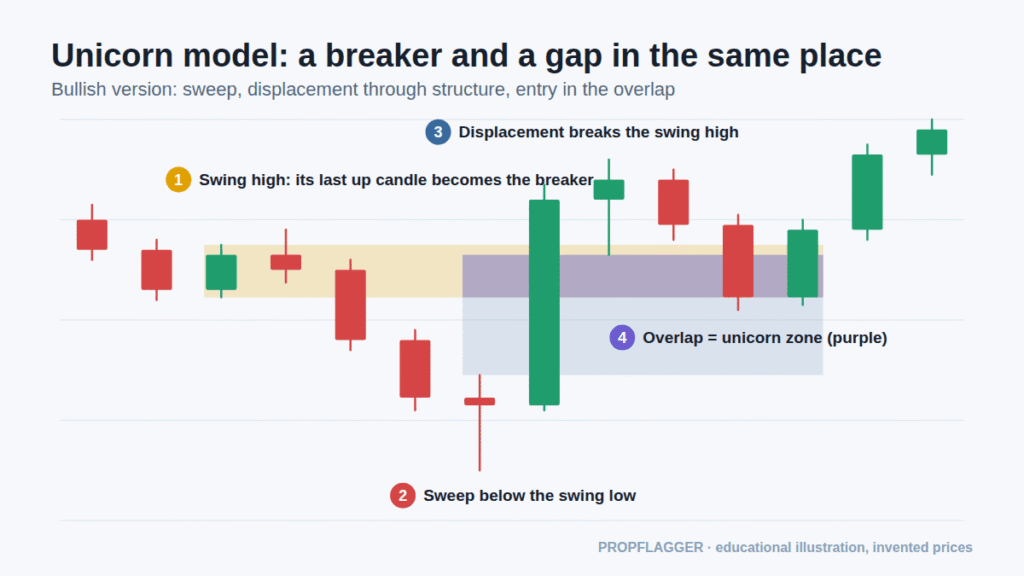
- A swing high forms. Its last up-close candle will later become the breaker.
- Price sweeps a swing low below it, taking sell-side liquidity (see liquidity).
- Displacement breaks the swing high. The strong move up closes through structure and leaves a gap.
- The gap lands on the breaker. Where the gap and the breaker candles share a price range, that is the unicorn zone.
How would I plan the trade?
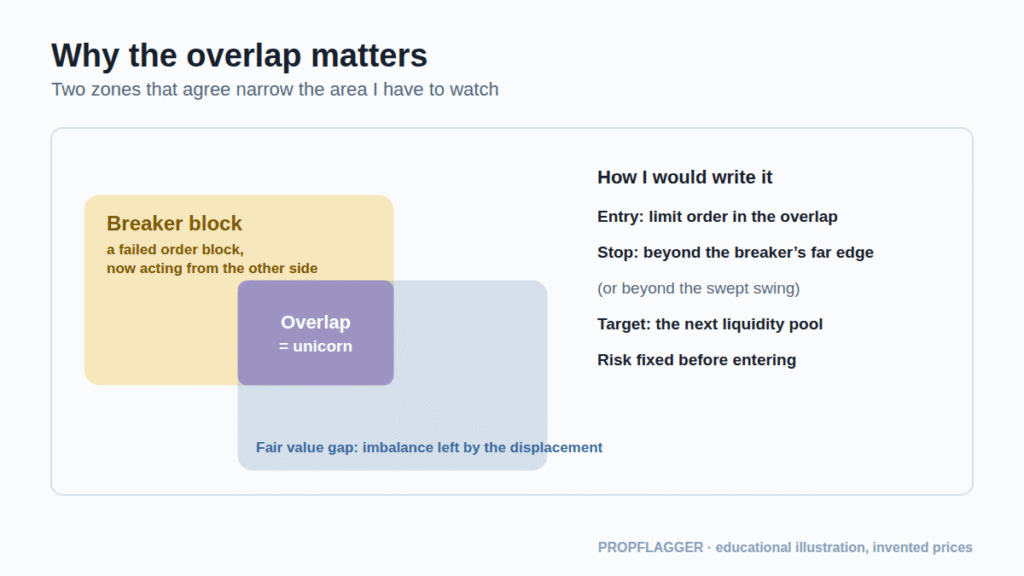
- Entry: a limit order inside the overlap.
- Stop: beyond the far edge of the breaker, or beyond the swept swing. Which one I use is a parameter I fix before testing.
- Target: the next liquidity pool or the previous swing, not a number picked on the day.
- Size: from the stop distance, as in the risk management guide.
How is it different from a breaker or an FVG entry?
A breaker entry uses the failed order block alone. An FVG entry uses the gap alone. The unicorn insists on both, so it is stricter, and the zone is usually smaller, which can give a tighter stop. It is also an easy pattern to talk yourself into, because with enough zoomed-in candles something will overlap.
What are the weak points?
- Definition drift: breakers and gaps are drawn differently by different teachers, so the overlap can appear or vanish.
- Rarity: needing two conditions means fewer valid trades, so it takes longer to gather a meaningful sample.
- No independent evidence: I only found educator and indicator-vendor material.
- Tight zones, wide spreads: a small zone can be missed by the spread or slippage.
How would I journal it?
I would log the swing that formed the breaker, the sweep, the displacement candle, the gap boundaries and the overlap range, plus a screenshot taken before entry. Each trade gets a yes/no checklist and a result in R (see the journal guide). After 30 to 100 trades I can compare unicorn trades against plain FVG and breaker entries from the same sessions, counting overlapping trades only once.
Reminder: I make no claim or guarantee of profit or success from anything described here. Examples are invented or illustrative and real results will differ. If you choose to trade, you are responsible for your own decisions and risk.

1 comment