

No claims, no guarantees. These are my personal study notes, written for education. I am not claiming that this model works, that it is profitable or that it will work for you. Nothing here is financial advice, a signal or a recommendation to trade. Trading carries a substantial risk of loss, and most retail traders lose money. See the full disclaimer.
What is Turtle Soup?
The first thing I learned about Turtle Soup is that it is not originally an ICT idea. It was published in the mid-1990s in Street Smarts by Laurence Connors and Linda Raschke, and the name is a joke at the expense of the Turtles, the trend-following traders whose rules bought 20-day breakouts. Raschke’s observation was that many of those breakouts failed, so there might be something to trade in the reversal.
It is one of the twelve models in my ICT research notes, and probably the easiest to define on paper.
What was the original rule?
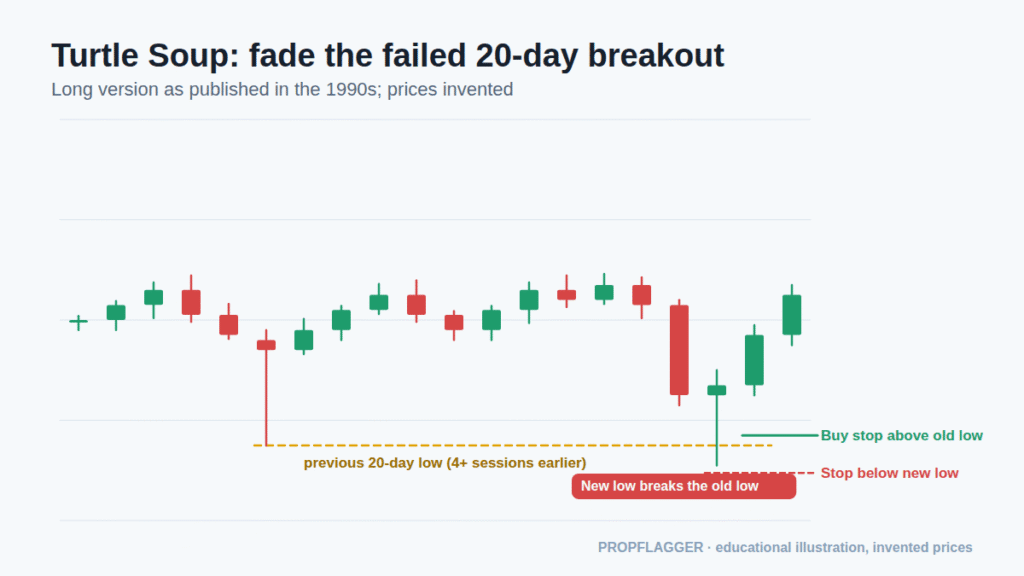
For the long side, as I understand it:
- Price makes a new 20-day low.
- The previous 20-day low was set at least four sessions earlier.
- Enter on a stop order back above that previous low, so the trade only triggers if the breakout is already failing.
- Place the protective stop below the new low.
The short side mirrors this with 20-day highs. I have only seen these rules described secondhand, so if I ever test them I would go back to the book.
How did ICT and SMC traders reuse it?
In ICT vocabulary the same chart event is a liquidity sweep: price runs an obvious prior high or low, the resting orders are taken, and price fails to hold beyond the level. The reversal that follows is the trade.
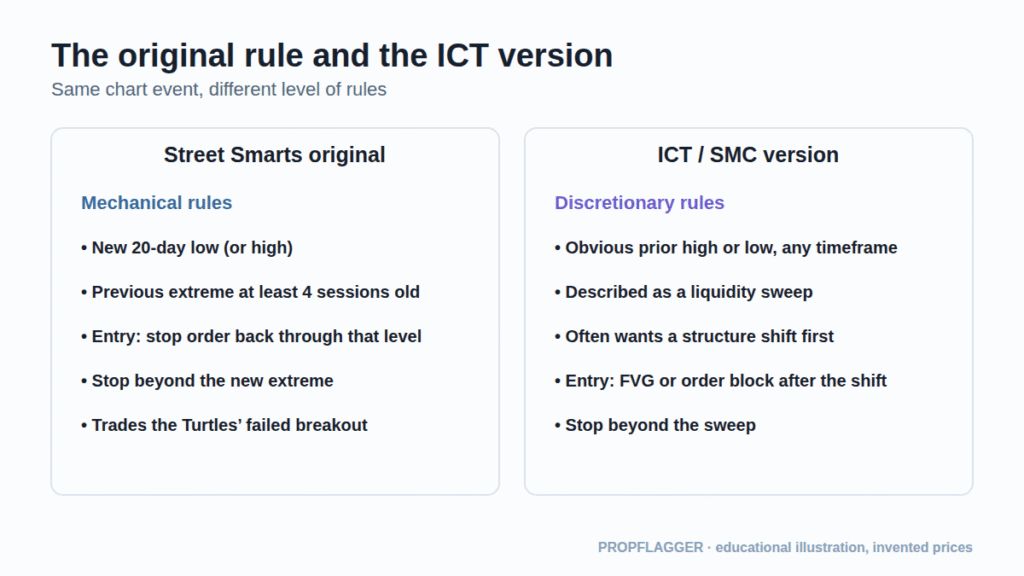
The big difference is that the original is a mechanical rule, while the ICT version is discretionary and usually wants a structure shift first (see market structure). That is the same sweep-then-shift skeleton as the 2022 Model.
How does it relate to other models?
- Judas Swing: a false move at a session open; Turtle Soup is a false move at a prior high or low.
- Silver Bullet: uses a sweep too, but limits it to three one-hour windows.
- Market Maker models: a sweep is the “price run” stage in that cycle.
What are the weak points?
- Trends can continue: some breakouts are real, and fading them can lose repeatedly.
- Choice of lookback: 20 days is a convention. Changing it until the history looks good is overfitting (see types of trading strategies).
- Old edge, new market: a 1990s rule may behave differently after decades of widespread use.
- Costs: countertrend trades near extremes can suffer slippage.
How would I test it?
Two separate tests: the mechanical original with a fixed lookback, and the discretionary sweep version with a written checklist. I would log each qualifying event, including the ones I did not take, record the result in R, and compare the two versions on the same instrument and period. Any conclusion needs a large sample and costs included.
Reminder: I make no claim or guarantee of profit or success from anything described here. Examples are invented or illustrative and real results will differ. If you choose to trade, you are responsible for your own decisions and risk.
1 comment