

No claims, no guarantees. These are my personal study notes, written for education. I am not claiming that this model works, that it is profitable or that it will work for you. Nothing here is financial advice, a signal or a recommendation to trade. Trading carries a substantial risk of loss, and most retail traders lose money. See the full disclaimer.
What is the ICT 2022 Model?
When I started reading about ICT, the 2022 Model was the name that kept appearing in other people’s notes. It comes from the 2022 mentorship of Michael J. Huddleston (Inner Circle Trader), and it is best understood as a sequence rather than a pattern: price raids a marked level of liquidity, displaces away, shifts structure, and then returns to an imbalance where an entry is planned.
This is one of twelve models I compared in my ICT trading models research notes. I picked it first because almost every other model reuses parts of it.
What are the steps of the 2022 Model?
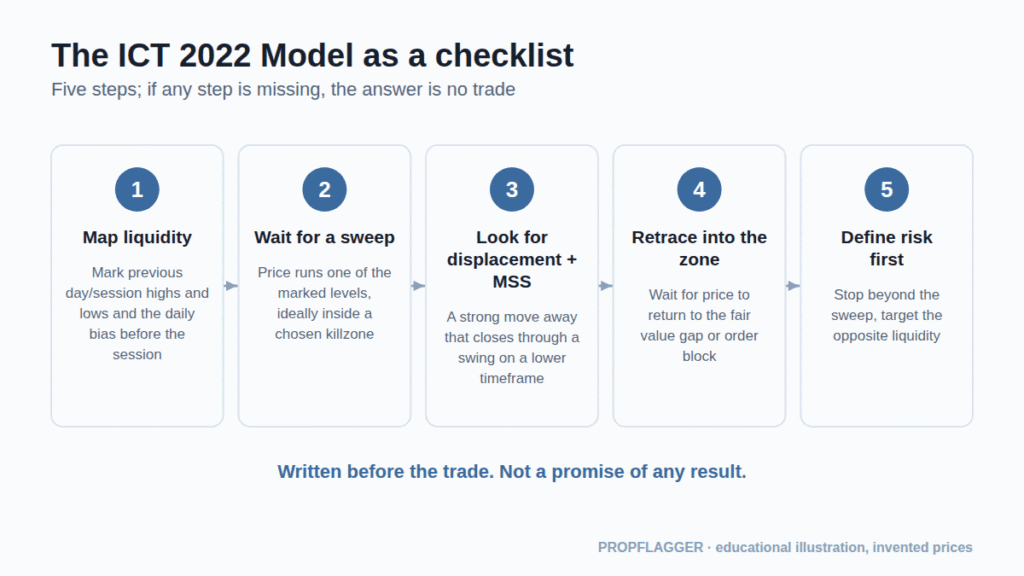
- Map liquidity. Before the session I mark obvious highs and lows: the previous day’s high and low, session extremes, equal highs or lows. I also write down a bias (up, down or none).
- Wait for a sweep. Price must trade through one of the marked levels and fail to hold. See my guide to liquidity for why traders treat these levels as magnets.
- Look for displacement and an MSS. A strong move away, closing through a swing on a lower timeframe. That is the market structure shift (see market structure).
- Wait for the retracement. Price is expected to return to the fair value gap (or order block) that the displacement left behind. My FVG entry notes and order block notes cover how those zones are drawn.
- Define risk first. The stop sits beyond the sweep and the target is the opposite liquidity pool. If I cannot see a clean target, I log “no trade”.
What does a bearish example look like?
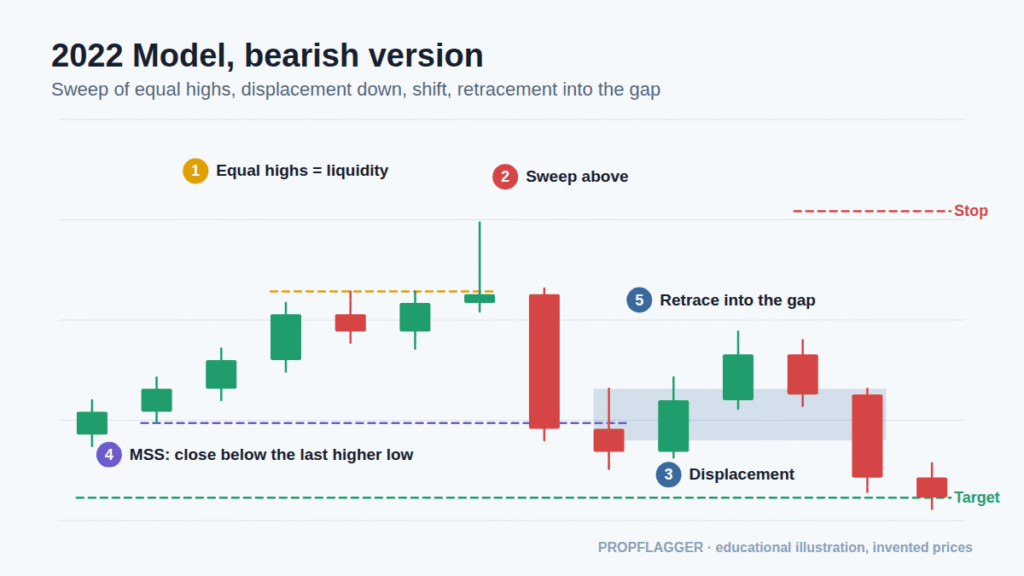
The mirror image is just as common. Equal highs build above price, price sweeps them, then drops with large candles and closes below the last higher low. The retracement back up into the gap is where the short idea would be planned, with the stop above the sweep.
How does it differ from the Silver Bullet and the Market Maker models?
- Silver Bullet: the same logic, but compressed into three one-hour windows.
- Market Maker models: the same logic, drawn as a larger five-stage cycle.
- Unicorn and Breaker: variations on which entry zone is used after the shift.
What are the weak points I see?
- Subjectivity: “obvious” liquidity and a “strong” displacement are judgements. Two people mark them differently.
- Hindsight: every chart looks like a 2022 Model after the move. I mark levels before the session.
- Many steps, many ways to fail: a sweep with no displacement, a shift with no gap, a gap that gets filled straight through.
- No independent evidence: I found only educator material and indicator-vendor descriptions.
How would I journal and test it?
- Write the rule: what counts as a sweep, a displacement and an MSS, in one paragraph.
- Turn it into a yes/no checklist (on this site, the Strategy Match).
- Fix risk per trade and the stop rule before entering (see risk management).
- Save an original and an annotated chart; record the result in R and whether I followed the plan.
- Collect at least 30–100 trades before reading anything into the numbers, and count overlapping Silver Bullet trades once.
The trading journal guide explains the fields I use.
Reminder: I make no claim or guarantee of profit or success from anything described here. Examples are invented or illustrative and real results will differ. If you choose to trade, you are responsible for your own decisions and risk.


1 comment