

No claims, no guarantees. These are my personal study notes, written for education. I am not claiming that this model works, that it is profitable or that it will work for you. Nothing here is financial advice, a signal or a recommendation to trade. Trading carries a substantial risk of loss, and most retail traders lose money. See the full disclaimer.
What is ICT Optimal Trade Entry?
Optimal Trade Entry (OTE) is the one model in my ICT research notes that I could reduce to a single formula. It names a retracement band, roughly 61.8% to 79% of an impulse leg, with 70.5% (the midpoint) often marked as the preferred level.
It is rarely traded alone. It normally follows a sweep and a structure shift, and it is usually combined with a fair value gap or an order block sitting inside the band.
How do I calculate the levels?
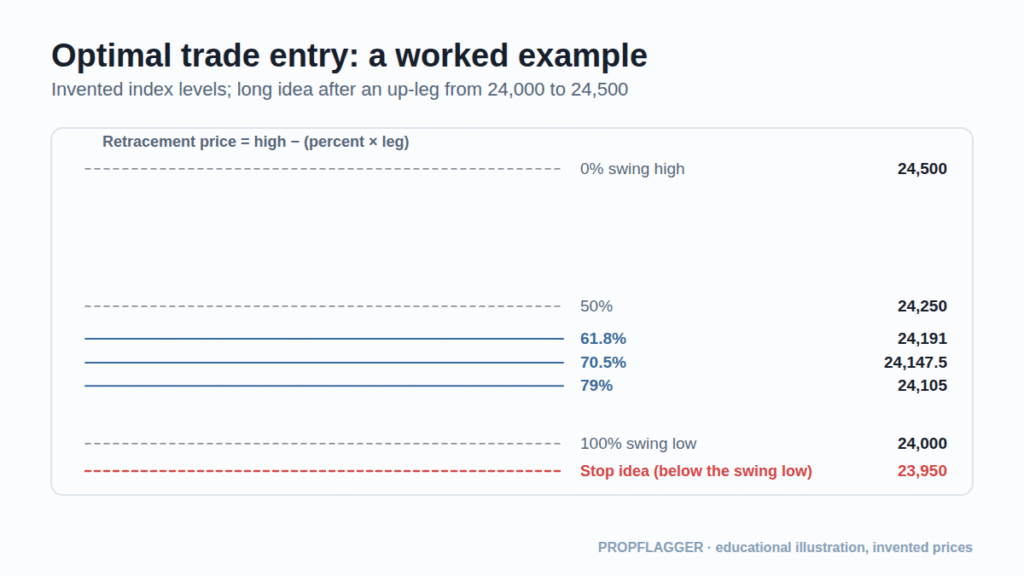
For a long idea: retracement price = swing high − (percent × leg size). A worked example with invented index levels:
| Level | Calculation | Price |
|---|---|---|
| 61.8% | 24,500 − 0.618 × 500 | 24,191 |
| 70.5% | 24,500 − 0.705 × 500 | 24,147.5 |
| 79% | 24,500 − 0.79 × 500 | 24,105 |
| Stop idea | below the swing low | 23,950 |
With an entry at 24,147.5 and a stop at 23,950, the risk is 197.5 points. Position size would come from that distance (see risk management).
How does it work in both directions?
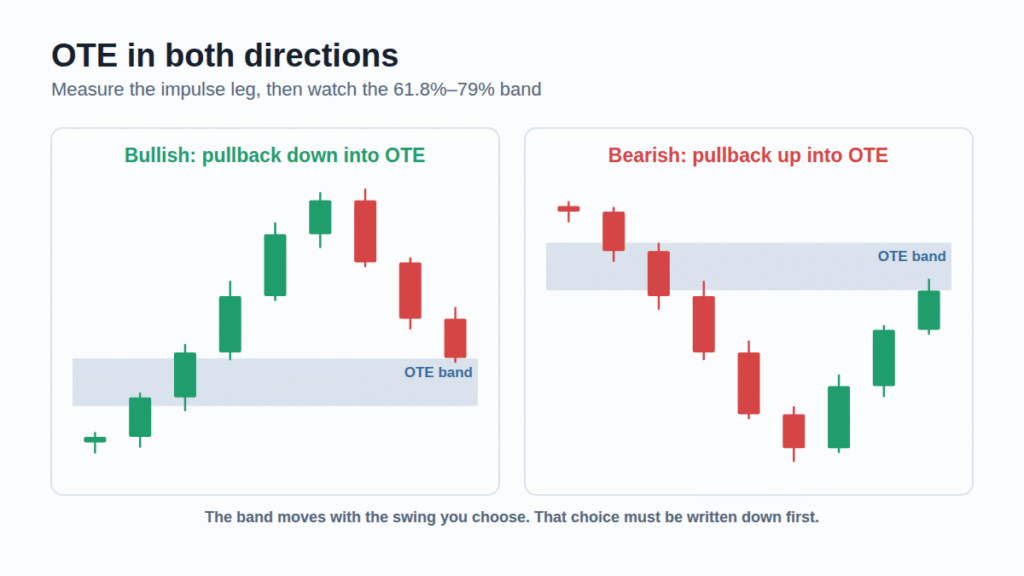
After a down-leg the band sits above the low, and the pullback is up into it. The mirror calculation adds the percentage of the leg to the swing low.
Why is the swing the real problem?
The formula is exact, but the leg is a judgement. Which swing low and swing high do I measure? Move the anchor by a few candles and the band moves too. If I choose the anchor after seeing what price did, the band will appear to “work” every time. So before testing, I would write the rule: “the leg starts at the swept low and ends at the high made by the displacement”.
What trade-offs do I see?
- Closer stop: a deeper entry puts the stop near the swing origin, so the same risk buys a larger position.
- Missed trades: price often turns before it reaches a deep level, and then nothing happens.
- Popular levels: Fibonacci levels are widely watched, but I found no independent test of this specific band.
- Overfitting: adjusting the band edges (0.62, 0.65, 0.705, 0.786) until history looks good.
How would I journal it?
For each trade I would record the swing anchors, the exact retracement percentage at entry, whether a gap or order block sat inside the band, the stop, and the result in R. After 30 to 100 trades I could compare entries at 62%, 70.5% and 79% to see if the depth mattered, using my own data and not a recommendation. See the 2022 Model for the sequence OTE usually plugs into.
Reminder: I make no claim or guarantee of profit or success from anything described here. Examples are invented or illustrative and real results will differ. If you choose to trade, you are responsible for your own decisions and risk.
2 comments